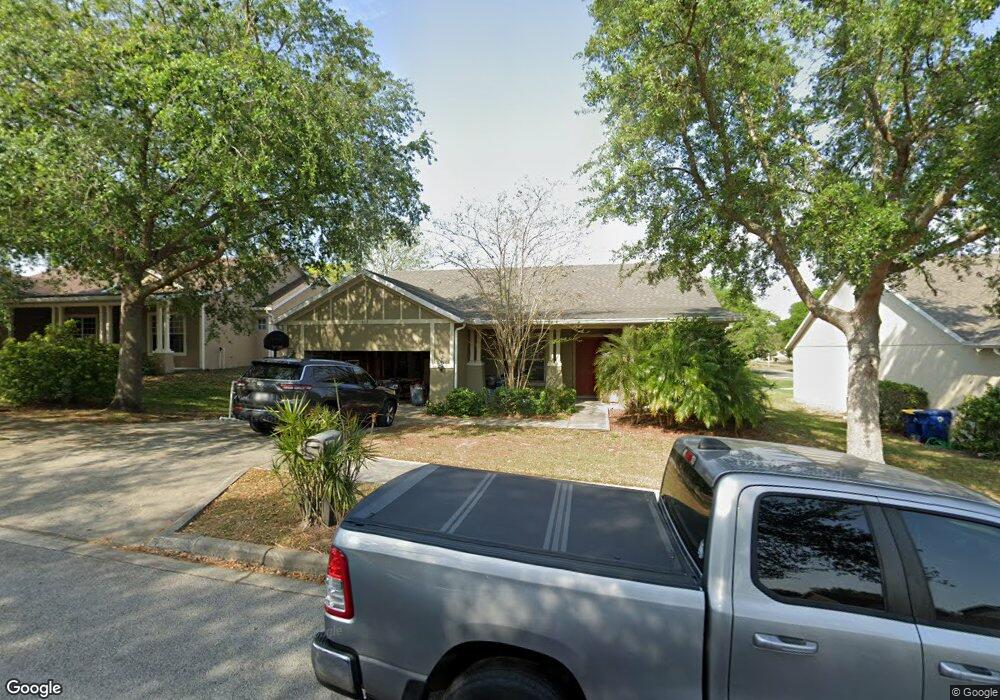
832 Willow Oak Loop Minneola, FL 34715
Estimated Value: $378,683 - $459,000
3
Beds
2
Baths
2,104
Sq Ft
$194/Sq Ft
Est. Value
About This Home
This home is located at 832 Willow Oak Loop, Minneola, FL 34715 and is currently estimated at $408,421, approximately $194 per square foot. 832 Willow Oak Loop is a home located in Lake County with nearby schools including Aurelia Cole Academy, South Lake High School, and Minneola Elementary Charter School.
Ownership History
Date
Name
Owned For
Owner Type
Purchase Details
Closed on
Aug 6, 2020
Sold by
Atchley Lowell Ralph and Lowell Ralph Atchley Revocable
Bought by
Atchley Gloria T and Atchley Lowell Ralph
Current Estimated Value
Purchase Details
Closed on
May 18, 2012
Sold by
Hurry Basil R and Hurry Diana L
Bought by
Atchley Lowell Ralph
Purchase Details
Closed on
Sep 25, 2009
Sold by
Sadick Mohamed O
Bought by
Hurry Basil R and Hurry Diana L
Home Financials for this Owner
Home Financials are based on the most recent Mortgage that was taken out on this home.
Original Mortgage
$117,536
Interest Rate
5.22%
Mortgage Type
FHA
Purchase Details
Closed on
Dec 20, 2007
Sold by
J & J Building & Development Lc
Bought by
Sadick Mohamed O
Home Financials for this Owner
Home Financials are based on the most recent Mortgage that was taken out on this home.
Original Mortgage
$274,500
Interest Rate
6.11%
Mortgage Type
Purchase Money Mortgage
Create a Home Valuation Report for This Property
The Home Valuation Report is an in-depth analysis detailing your home's value as well as a comparison with similar homes in the area
Home Values in the Area
Average Home Value in this Area
Purchase History
| Date | Buyer | Sale Price | Title Company |
|---|---|---|---|
| Atchley Gloria T | -- | Attorney | |
| Atchley Lowell Ralph | $133,000 | Attorney | |
| Hurry Basil R | $121,000 | A Z Team Title Llc | |
| Sadick Mohamed O | $305,000 | Florida Lakes Title & Closin |
Source: Public Records
Mortgage History
| Date | Status | Borrower | Loan Amount |
|---|---|---|---|
| Previous Owner | Hurry Basil R | $117,536 | |
| Previous Owner | Sadick Mohamed O | $274,500 |
Source: Public Records
Tax History
| Year | Tax Paid | Tax Assessment Tax Assessment Total Assessment is a certain percentage of the fair market value that is determined by local assessors to be the total taxable value of land and additions on the property. | Land | Improvement |
|---|---|---|---|---|
| 2026 | $5,350 | $332,098 | $70,150 | $261,948 |
| 2025 | $5,055 | $332,098 | $70,150 | $261,948 |
| 2024 | $5,055 | $332,098 | $70,150 | $261,948 |
| 2023 | $5,055 | $323,660 | $70,150 | $253,510 |
| 2022 | $4,440 | $261,636 | $37,950 | $223,686 |
| 2021 | $3,972 | $209,888 | $0 | $0 |
| 2020 | $3,709 | $197,383 | $0 | $0 |
| 2019 | $3,661 | $197,383 | $0 | $0 |
| 2018 | $3,139 | $156,743 | $0 | $0 |
| 2017 | $2,933 | $144,916 | $0 | $0 |
| 2016 | $3,244 | $158,991 | $0 | $0 |
| 2015 | $3,132 | $153,574 | $0 | $0 |
| 2014 | $2,830 | $132,947 | $0 | $0 |
Source: Public Records
Map
Nearby Homes
- 950 Willow Oak Loop
- 17528 E Apshawa Rd
- 1985 Burgundy Dr
- 2133 Malbec Ct
- TBD Kanuba Ct
- 756 Rioja Dr
- 740 Rioja Dr
- 2081 Malbec Ct
- 1319 Rain Forest Ln
- 18021 E Apshawa Rd
- 1305 Windy Bluff Dr
- 17730 US Highway 27 Unit 43
- 1104 Chateau Cir
- 11155 Cherry Lake Rd
- 20404 Wolf Springs Ct
- 646 Park Valley Cir
- 11417 Lake Minneola Shores
- 11349 Lake Minneola Shores
- 11210 Elderberry Ct
- 11722 Lake Minneola Shores
- 836 Willow Oak Loop
- 828 Willow Oak Loop
- 11440 Tuscarora Ln
- 824R Willow Oak Loop
- 900 White Oak Way
- 824 Willow Oak Loop
- 840 Willow Oak Loop
- 903 Willow Oak Loop
- 901 White Oak Way
- 820 Willow Oak Loop
- 904 White Oak Way
- 907 Willow Oak Loop
- 905 White Oak Way
- 816 Willow Oak Loop
- 11430 Tuscarora Ln
- 908 White Oak Way
- 911 Willow Oak Loop
- 902 Willow Oak Loop
- 904 Black Oak Way
- 1911 Summit Oaks Cir
Your Personal Tour Guide
Ask me questions while you tour the home.