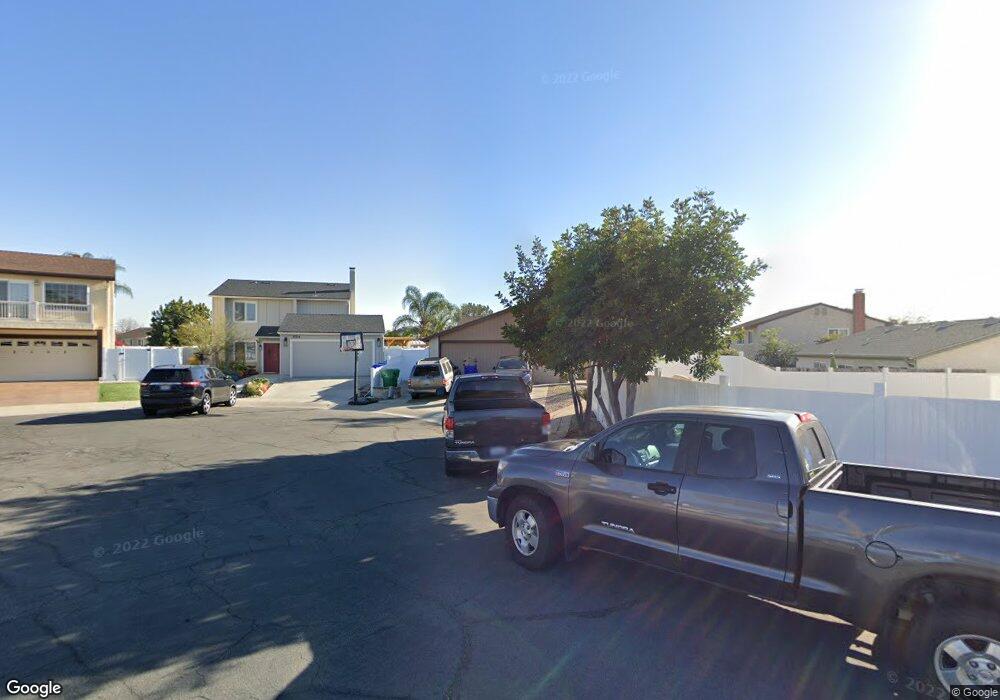
8322 High Winds Way San Diego, CA 92120
San Carlos NeighborhoodEstimated Value: $992,614 - $1,256,000
4
Beds
2
Baths
1,344
Sq Ft
$829/Sq Ft
Est. Value
About This Home
This home is located at 8322 High Winds Way, San Diego, CA 92120 and is currently estimated at $1,113,904, approximately $828 per square foot. 8322 High Winds Way is a home located in San Diego County with nearby schools including Ralph Dailard Elementary School, Pershing Middle School, and Patrick Henry High School.
Ownership History
Date
Name
Owned For
Owner Type
Purchase Details
Closed on
Sep 26, 2005
Sold by
Ingalls Richard Martin
Bought by
Ingalls Richard Martin
Current Estimated Value
Home Financials for this Owner
Home Financials are based on the most recent Mortgage that was taken out on this home.
Original Mortgage
$378,000
Outstanding Balance
$201,813
Interest Rate
5.72%
Mortgage Type
New Conventional
Estimated Equity
$912,091
Purchase Details
Closed on
Jun 11, 2004
Sold by
Ingalls Richard M
Bought by
Ingalls Richard Martin
Purchase Details
Closed on
May 16, 1994
Sold by
Va
Bought by
Ingalls Richard M
Home Financials for this Owner
Home Financials are based on the most recent Mortgage that was taken out on this home.
Original Mortgage
$183,779
Interest Rate
8.3%
Mortgage Type
Seller Take Back
Purchase Details
Closed on
Aug 10, 1987
Create a Home Valuation Report for This Property
The Home Valuation Report is an in-depth analysis detailing your home's value as well as a comparison with similar homes in the area
Home Values in the Area
Average Home Value in this Area
Purchase History
| Date | Buyer | Sale Price | Title Company |
|---|---|---|---|
| Ingalls Richard Martin | -- | -- | |
| Ingalls Richard Martin | -- | Stewart Title Company | |
| Ingalls Richard Martin | -- | -- | |
| Ingalls Richard M | $184,000 | South Coast Title Co | |
| -- | $135,500 | -- |
Source: Public Records
Mortgage History
| Date | Status | Borrower | Loan Amount |
|---|---|---|---|
| Open | Ingalls Richard Martin | $378,000 | |
| Closed | Ingalls Richard M | $183,779 |
Source: Public Records
Tax History Compared to Growth
Tax History
| Year | Tax Paid | Tax Assessment Tax Assessment Total Assessment is a certain percentage of the fair market value that is determined by local assessors to be the total taxable value of land and additions on the property. | Land | Improvement |
|---|---|---|---|---|
| 2025 | $3,796 | $312,329 | $214,177 | $98,152 |
| 2024 | $3,796 | $306,206 | $209,978 | $96,228 |
| 2023 | $3,711 | $300,203 | $205,861 | $94,342 |
| 2022 | $3,613 | $294,318 | $201,825 | $92,493 |
| 2021 | $3,588 | $288,548 | $197,868 | $90,680 |
| 2020 | $3,545 | $285,591 | $195,840 | $89,751 |
| 2019 | $3,482 | $279,992 | $192,000 | $87,992 |
| 2018 | $3,257 | $274,503 | $188,236 | $86,267 |
| 2017 | $3,179 | $269,122 | $184,546 | $84,576 |
| 2016 | $3,128 | $263,846 | $180,928 | $82,918 |
| 2015 | $3,082 | $259,884 | $178,211 | $81,673 |
| 2014 | $3,034 | $254,795 | $174,721 | $80,074 |
Source: Public Records
Map
Nearby Homes
- 6310 Decanture St
- 7740 Margerum Ave Unit 204
- 8128 Hillandale Dr
- 6715 Monte Verde Dr
- 7890 Mission Vista Dr
- 6638 Bell Bluff Ave Unit A
- 6670 Bell Bluff Ave
- 6763 Caminito Del Greco
- 5946 Crow Ct
- 6878 Navajo Rd Unit 70
- 6816 Hyde Park Dr Unit N
- 7173 Eldridge St
- 7104 Ruane St
- 5461 Brunswick Ave
- 6625 Casselberry Way
- 6994 Carthage St
- 6815 Caminito Mundo Unit 23
- 6641 Murray Park Dr
- 11464 Azucena Dr
- 11655 Cebada Ct
- 8314 High Winds Way
- 8369 Ridge Route Rd
- 8359 Ridge Route Rd
- 8379 Ridge Route Rd
- 8329 Laurelridge Rd
- 8319 Laurelridge Rd
- 8339 Laurelridge Rd
- 8349 Laurelridge Rd
- 8309 Laurelridge Rd
- 8307 High Winds Way
- 8323 High Winds Way
- 8331 High Winds Way
- 8315 High Winds Way
- 6766 Mountain Top Ct
- 6774 Mountain Top Ct
- 8289 Laurelridge Rd
- 8339 High Winds Way
- 6782 Mountain Top Ct
- 8358 Ridge Route Rd
- 8366 Ridge Route Rd