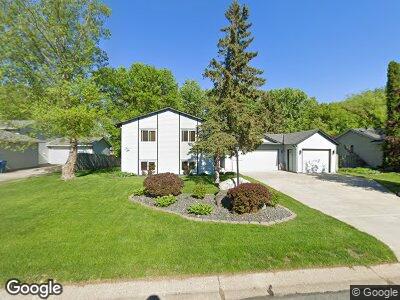
8324 Cooper Way Inver Grove Heights, MN 55076
Estimated Value: $378,871 - $403,000
2
Beds
2
Baths
1,104
Sq Ft
$355/Sq Ft
Est. Value
About This Home
This home is located at 8324 Cooper Way, Inver Grove Heights, MN 55076 and is currently estimated at $391,718, approximately $354 per square foot. 8324 Cooper Way is a home located in Dakota County with nearby schools including Pine Bend Elementary School, Inver Grove Heights Middle School, and Simley Senior High School.
Ownership History
Date
Name
Owned For
Owner Type
Purchase Details
Closed on
Mar 16, 2006
Sold by
Beermann Burnell
Bought by
Steinhoff Paul A and Dufour Michelle L
Current Estimated Value
Home Financials for this Owner
Home Financials are based on the most recent Mortgage that was taken out on this home.
Original Mortgage
$181,500
Interest Rate
6.38%
Mortgage Type
New Conventional
Purchase Details
Closed on
Jul 13, 2005
Sold by
Cavazos Armando and Cavazos Monica
Bought by
Beermann Burnell
Home Financials for this Owner
Home Financials are based on the most recent Mortgage that was taken out on this home.
Original Mortgage
$180,900
Interest Rate
5.74%
Mortgage Type
New Conventional
Purchase Details
Closed on
Oct 12, 2001
Sold by
Cicchese Anthony W and Neumann Melanie J
Bought by
Cavazos Armando and Cavazos Monica
Purchase Details
Closed on
Nov 17, 2000
Sold by
Scott James M and Scott Rita M
Bought by
Cicchese Anthony W and Cicchese Melanie
Create a Home Valuation Report for This Property
The Home Valuation Report is an in-depth analysis detailing your home's value as well as a comparison with similar homes in the area
Home Values in the Area
Average Home Value in this Area
Purchase History
| Date | Buyer | Sale Price | Title Company |
|---|---|---|---|
| Steinhoff Paul A | $269,000 | -- | |
| Beermann Burnell | $201,000 | -- | |
| Cavazos Armando | $189,900 | -- | |
| Cicchese Anthony W | $173,000 | -- |
Source: Public Records
Mortgage History
| Date | Status | Borrower | Loan Amount |
|---|---|---|---|
| Open | Dufour Michelle L | $177,500 | |
| Closed | Steinhoff Paul A | $80,000 | |
| Closed | Steinhoff Paul A | $181,500 | |
| Previous Owner | Beermann Burnell | $180,900 |
Source: Public Records
Tax History Compared to Growth
Tax History
| Year | Tax Paid | Tax Assessment Tax Assessment Total Assessment is a certain percentage of the fair market value that is determined by local assessors to be the total taxable value of land and additions on the property. | Land | Improvement |
|---|---|---|---|---|
| 2023 | $3,608 | $353,900 | $82,300 | $271,600 |
| 2022 | $3,370 | $353,100 | $82,200 | $270,900 |
| 2021 | $3,276 | $310,500 | $71,500 | $239,000 |
| 2020 | $3,078 | $297,900 | $68,100 | $229,800 |
| 2019 | $3,206 | $280,700 | $64,800 | $215,900 |
| 2018 | $2,955 | $272,900 | $61,700 | $211,200 |
| 2017 | $2,685 | $252,000 | $58,800 | $193,200 |
| 2016 | $2,590 | $226,600 | $56,000 | $170,600 |
| 2015 | $2,595 | $200,598 | $50,287 | $150,311 |
| 2014 | -- | $188,281 | $47,867 | $140,414 |
| 2013 | -- | $177,272 | $44,228 | $133,044 |
Source: Public Records
Map
Nearby Homes
- 8200 Custer Trail
- 8483 Corcoran Path Unit 62
- 8285 Cleadis Ave
- 8366 Claymore Ct
- 8289 Delaney Dr Unit 24
- 8634 Corbin Ct
- 8644 Corcoran Path
- 7996 Corey Path
- 8571 Crismon Way
- 8767 Concord Ct
- 3135 Cuneen Trail
- 8664 Callahan Trail
- 3255 80th St E Unit 102
- 8440 Delaney Ct
- 3979 78th St E
- 3912 76th Way E
- 8765 River Heights Way
- 7617 Cody Ln
- 8981 Coffman Path
- 7604 Cody Ln
- 8324 Cooper Way
- 8320 Cooper Way
- 8330 Cooper Way
- 8314 Cooper Way
- 8340 Cooper Way
- 8340 Cooper Way E
- 8325 Cooper Way
- 8321 Cooper Way
- 8345 Copperfield Way
- 8335 Cooper Way
- 8287 Copperfield Ct
- 8325 Copperfield Way
- 8315 Cooper Way
- 8277 Copperfield Ct
- 8308 Cooper Way
- 8308 Cooper Way E
- 8350 Cooper Way
- 8297 Copperfield Ct
- 8309 Cooper Way
- 8375 Copperfield Way