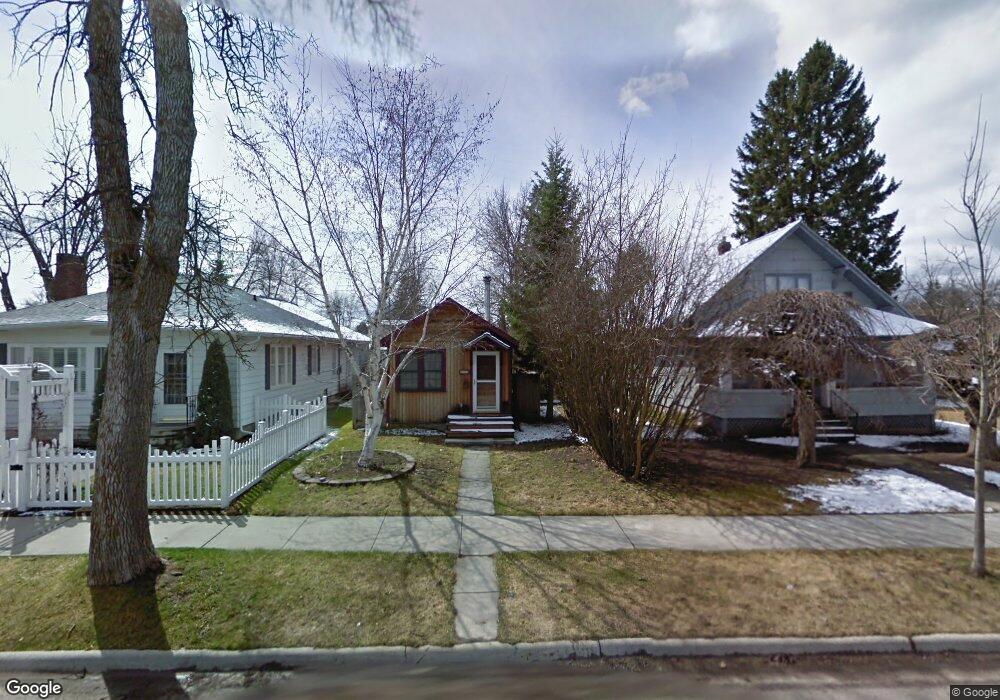
833 2nd St E Whitefish, MT 59937
Estimated Value: $492,153 - $705,000
1
Bed
1
Bath
680
Sq Ft
$896/Sq Ft
Est. Value
About This Home
This home is located at 833 2nd St E, Whitefish, MT 59937 and is currently estimated at $609,038, approximately $895 per square foot. 833 2nd St E is a home located in Flathead County with nearby schools including L.A. Muldown School, Whitefish Middle School, and Whitefish High School.
Ownership History
Date
Name
Owned For
Owner Type
Purchase Details
Closed on
Aug 8, 2025
Sold by
Foy Stanley A and Foy Elizabeth A
Bought by
Scott Joel Manford and Scott Casey
Current Estimated Value
Home Financials for this Owner
Home Financials are based on the most recent Mortgage that was taken out on this home.
Original Mortgage
$365,050
Outstanding Balance
$364,329
Interest Rate
6.77%
Mortgage Type
Credit Line Revolving
Estimated Equity
$244,709
Purchase Details
Closed on
Apr 22, 2025
Sold by
Foy Logan
Bought by
Foy Stanley A and Foy Elizabeth A
Purchase Details
Closed on
Aug 3, 2022
Sold by
Semler Bruce E
Bought by
Foy Logan
Home Financials for this Owner
Home Financials are based on the most recent Mortgage that was taken out on this home.
Original Mortgage
$250,000
Interest Rate
5.81%
Mortgage Type
New Conventional
Purchase Details
Closed on
Sep 24, 2013
Sold by
Christensen Lee Anne
Bought by
Semler Bruce E
Purchase Details
Closed on
Jun 14, 2005
Sold by
Edwards Appel
Bought by
Christensen Lee Anne
Create a Home Valuation Report for This Property
The Home Valuation Report is an in-depth analysis detailing your home's value as well as a comparison with similar homes in the area
Home Values in the Area
Average Home Value in this Area
Purchase History
| Date | Buyer | Sale Price | Title Company |
|---|---|---|---|
| Scott Joel Manford | -- | Modern Title | |
| Foy Stanley A | -- | None Listed On Document | |
| Foy Logan | -- | None Listed On Document | |
| Semler Bruce E | -- | None Available | |
| Christensen Lee Anne | -- | Stewart Title Services |
Source: Public Records
Mortgage History
| Date | Status | Borrower | Loan Amount |
|---|---|---|---|
| Open | Scott Joel Manford | $365,050 | |
| Previous Owner | Foy Logan | $250,000 |
Source: Public Records
Tax History
| Year | Tax Paid | Tax Assessment Tax Assessment Total Assessment is a certain percentage of the fair market value that is determined by local assessors to be the total taxable value of land and additions on the property. | Land | Improvement |
|---|---|---|---|---|
| 2025 | $1,587 | $502,700 | $0 | $0 |
| 2024 | $2,047 | $409,000 | $0 | $0 |
| 2023 | $2,326 | $409,000 | $0 | $0 |
| 2022 | $2,020 | $283,900 | $0 | $0 |
| 2021 | $2,397 | $283,900 | $0 | $0 |
| 2020 | $2,108 | $227,400 | $0 | $0 |
| 2019 | $2,252 | $227,400 | $0 | $0 |
| 2018 | $1,864 | $179,900 | $0 | $0 |
| 2017 | $1,455 | $179,900 | $0 | $0 |
| 2016 | $1,591 | $165,400 | $0 | $0 |
| 2015 | $1,603 | $165,400 | $0 | $0 |
| 2014 | $1,467 | $89,517 | $0 | $0 |
Source: Public Records
Map
Nearby Homes
- 1050 E 4th St
- 560 Columbia Ave
- 555 Park Ave
- 5 Park Ave Unit Lot 19 & 20
- 602 Park Ave
- 620 E 6th St
- 20 Fir Ave
- 1319 3rd St
- 301 2nd St E Unit 2D
- 711 Park Ave
- 1013 E 7th St Unit D
- 22 Lupfer Ave Unit 202
- 220 2nd St E Unit 202
- 214 2nd St E Unit Suite 302
- 214 2nd St E Unit Suite 201
- 214 2nd St E Unit Suite 301
- 139 2nd St E Unit 204
- 104 Obrien Ave Unit A
- 104 Obrien Ave Unit B
- 841, 845, 851 Baker Ave
Your Personal Tour Guide
Ask me questions while you tour the home.