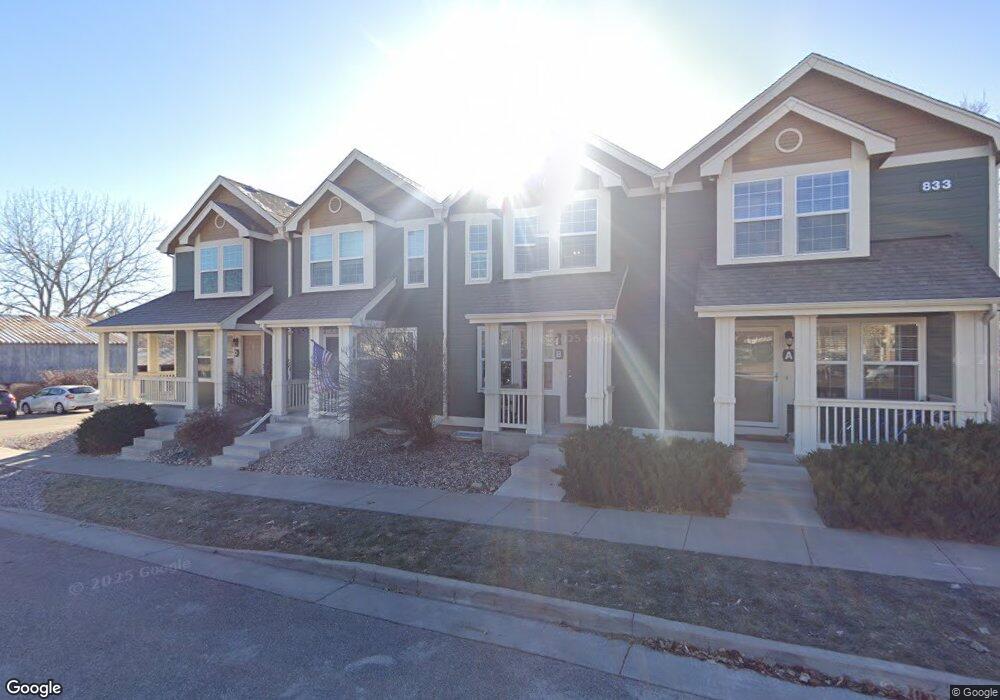
833 Apex Dr Unit B Fort Collins, CO 80525
Prospect at Spring Meadows NeighborhoodEstimated Value: $398,184 - $422,000
2
Beds
3
Baths
1,168
Sq Ft
$350/Sq Ft
Est. Value
About This Home
This home is located at 833 Apex Dr Unit B, Fort Collins, CO 80525 and is currently estimated at $408,296, approximately $349 per square foot. 833 Apex Dr Unit B is a home located in Larimer County with nearby schools including O'Dea Elementary School, Lesher Middle School, and Fort Collins High School.
Ownership History
Date
Name
Owned For
Owner Type
Purchase Details
Closed on
Jul 4, 2018
Sold by
Robb Mary Thomas and Thomas Serena Mary
Bought by
Thomas Serena Mary
Current Estimated Value
Purchase Details
Closed on
Dec 10, 2012
Sold by
Robb Philip James
Bought by
Robb Mary Thomas
Home Financials for this Owner
Home Financials are based on the most recent Mortgage that was taken out on this home.
Original Mortgage
$148,000
Outstanding Balance
$102,781
Interest Rate
3.42%
Mortgage Type
New Conventional
Estimated Equity
$305,515
Purchase Details
Closed on
Sep 3, 2010
Sold by
Fedel Laura L
Bought by
Robb Philip James and Robb Mary Thomas
Home Financials for this Owner
Home Financials are based on the most recent Mortgage that was taken out on this home.
Original Mortgage
$148,000
Interest Rate
4.55%
Mortgage Type
New Conventional
Purchase Details
Closed on
Apr 30, 2004
Sold by
John Walz Enterprises Inc
Bought by
Fedel Laura L
Create a Home Valuation Report for This Property
The Home Valuation Report is an in-depth analysis detailing your home's value as well as a comparison with similar homes in the area
Home Values in the Area
Average Home Value in this Area
Purchase History
| Date | Buyer | Sale Price | Title Company |
|---|---|---|---|
| Thomas Serena Mary | -- | None Available | |
| Robb Mary Thomas | -- | None Available | |
| Robb Philip James | $185,000 | Land Title Guarantee Company | |
| Fedel Laura L | $162,900 | Fahtco |
Source: Public Records
Mortgage History
| Date | Status | Borrower | Loan Amount |
|---|---|---|---|
| Open | Robb Mary Thomas | $148,000 | |
| Closed | Robb Philip James | $148,000 |
Source: Public Records
Tax History Compared to Growth
Tax History
| Year | Tax Paid | Tax Assessment Tax Assessment Total Assessment is a certain percentage of the fair market value that is determined by local assessors to be the total taxable value of land and additions on the property. | Land | Improvement |
|---|---|---|---|---|
| 2025 | $2,180 | $26,405 | $2,546 | $23,859 |
| 2024 | $2,074 | $26,405 | $2,546 | $23,859 |
| 2022 | $2,187 | $23,157 | $2,641 | $20,516 |
| 2021 | $2,210 | $23,824 | $2,717 | $21,107 |
| 2020 | $2,125 | $22,708 | $2,717 | $19,991 |
| 2019 | $2,134 | $22,708 | $2,717 | $19,991 |
| 2018 | $1,986 | $21,787 | $2,736 | $19,051 |
| 2017 | $1,979 | $21,787 | $2,736 | $19,051 |
| 2016 | $1,592 | $17,441 | $3,025 | $14,416 |
| 2015 | $1,581 | $17,440 | $3,020 | $14,420 |
| 2014 | $1,370 | $15,020 | $3,020 | $12,000 |
Source: Public Records
Map
Nearby Homes
- 1658 Freewheel Dr
- 1741 Brookhaven Cir E Unit D
- 1741 Brookhaven Cir E Unit A
- 1308 Robertson St
- 1804 Mohawk St
- 816 Buckeye St
- 1628 Smith Place
- 205 Circle Dr
- 1304 S Lemay Ave
- 1909 Pawnee Dr
- 1112 Robertson St
- 511 E Prospect Rd
- 160 Circle Dr
- 1125 Robertson St
- 1850 Indian Hills Cir
- 1204 Newsom St
- 1917 S Lemay Ave
- 422 E Prospect Rd
- 1202 Niagara Dr Unit 20
- 1539 Peterson St
- 833 Apex Dr Unit D
- 833 Apex Dr Unit C
- 833 Apex Dr Unit A
- 833 Apex Dr Unit 3A
- 833 Apex #B Dr
- 827 Apex Dr Unit D
- 827 Apex Dr Unit C
- 827 Apex Dr Unit B
- 827 Apex Dr Unit A
- 827 Apex Dr
- 1650 Robertson Unit D
- 1650 Robertson Unit C
- 1650 Robertson Unit B
- 1650 Robertson Unit A
- 1650 Robertson
- 845 Apex Dr
- 844 Apex Dr Unit A
- 844 Apex Dr Unit B
- 844 Apex Dr Unit C
- 844 Apex Dr Unit D