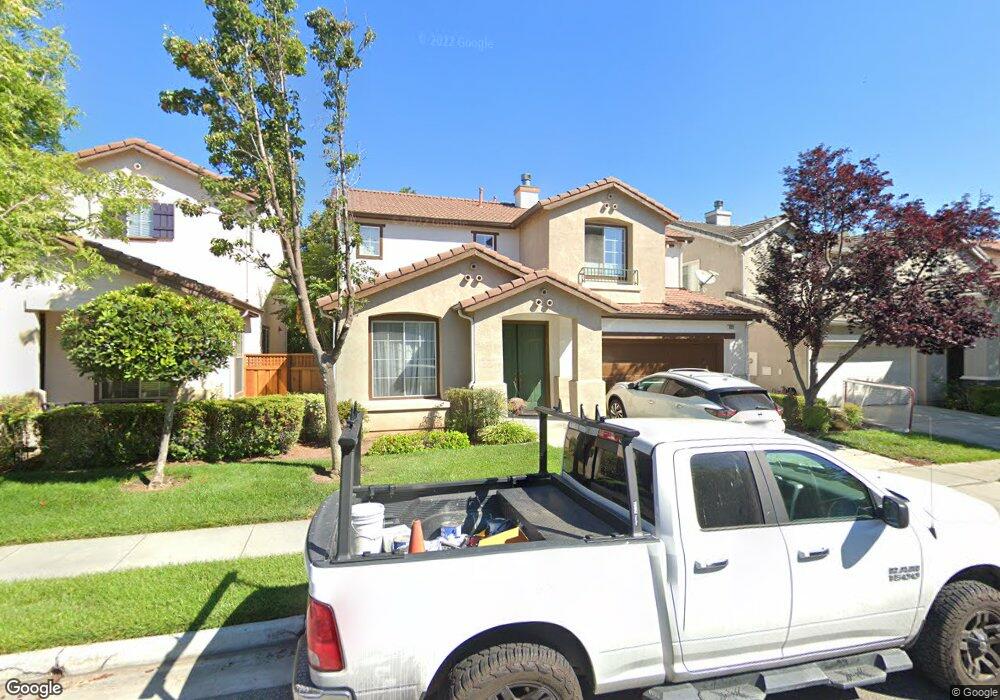
833 Pitkin Loop San Jose, CA 95125
South San Jose NeighborhoodEstimated Value: $1,878,712 - $2,283,000
5
Beds
3
Baths
2,654
Sq Ft
$785/Sq Ft
Est. Value
About This Home
This home is located at 833 Pitkin Loop, San Jose, CA 95125 and is currently estimated at $2,084,678, approximately $785 per square foot. 833 Pitkin Loop is a home located in Santa Clara County with nearby schools including Canoas Elementary School, John Muir Middle School, and Gunderson High School.
Ownership History
Date
Name
Owned For
Owner Type
Purchase Details
Closed on
Sep 29, 1999
Sold by
Kaufman & Broad South Bay Inc
Bought by
Trujillo Ted M and Trujillo Corinne A
Current Estimated Value
Home Financials for this Owner
Home Financials are based on the most recent Mortgage that was taken out on this home.
Original Mortgage
$476,600
Interest Rate
5.05%
Create a Home Valuation Report for This Property
The Home Valuation Report is an in-depth analysis detailing your home's value as well as a comparison with similar homes in the area
Home Values in the Area
Average Home Value in this Area
Purchase History
| Date | Buyer | Sale Price | Title Company |
|---|---|---|---|
| Trujillo Ted M | $530,500 | First American Title Guarant |
Source: Public Records
Mortgage History
| Date | Status | Borrower | Loan Amount |
|---|---|---|---|
| Previous Owner | Trujillo Ted M | $476,600 |
Source: Public Records
Tax History
| Year | Tax Paid | Tax Assessment Tax Assessment Total Assessment is a certain percentage of the fair market value that is determined by local assessors to be the total taxable value of land and additions on the property. | Land | Improvement |
|---|---|---|---|---|
| 2025 | $10,754 | $814,810 | $138,314 | $676,496 |
| 2024 | $10,754 | $798,834 | $135,602 | $663,232 |
| 2023 | $10,542 | $783,172 | $132,944 | $650,228 |
| 2022 | $10,452 | $767,817 | $130,338 | $637,479 |
| 2021 | $10,228 | $752,763 | $127,783 | $624,980 |
| 2020 | $9,990 | $745,045 | $126,473 | $618,572 |
| 2019 | $9,773 | $730,438 | $123,994 | $606,444 |
| 2018 | $9,673 | $716,116 | $121,563 | $594,553 |
| 2017 | $9,593 | $702,076 | $119,180 | $582,896 |
| 2016 | $9,413 | $688,311 | $116,844 | $571,467 |
| 2015 | $9,350 | $677,973 | $115,089 | $562,884 |
| 2014 | $8,898 | $664,693 | $112,835 | $551,858 |
Source: Public Records
Map
Nearby Homes
- 2777 Rubino Cir
- 3097 Pearl Ave
- 908 Redbird Dr
- 867 Ironwood Dr
- 2991 Almaden Rd
- 1202 Foxworthy Ave
- 126 Mountain Springs Dr Unit 126
- 255 Mountain Springs Dr
- 1148 Husted Ave
- 121 Mountain Springs Dr Unit 121
- 242 Mountain Springs Dr Unit 242
- 1111 Mayette Ave
- 532A Mill Pond Dr Unit 532 A
- 1036 Pascoe Ave
- 2540 Marsha Way
- 3120 Heather Ridge Dr
- 3115 Heather Ridge Dr
- 3300 Narvaez Ave Unit 175
- 2598 Cottle Ave
- 1126 Roy Ave
- 829 Pitkin Loop
- 837 Pitkin Loop
- 2764 Hageman Ct
- 825 Pitkin Loop
- 841 Pitkin Loop
- 2763 Blaine Ct
- 2758 Hageman Ct
- 2765 Hageman Ct
- 832 Pitkin Loop
- 828 Pitkin Loop
- 836 Pitkin Loop
- 2757 Blaine Ct
- 821 Pitkin Loop
- 845 Pitkin Loop
- 840 Pitkin Loop
- 2759 Hageman Ct
- 824 Pitkin Loop
- 2752 Hageman Ct
- 2751 Blaine Ct
- 844 Pitkin Loop
Your Personal Tour Guide
Ask me questions while you tour the home.