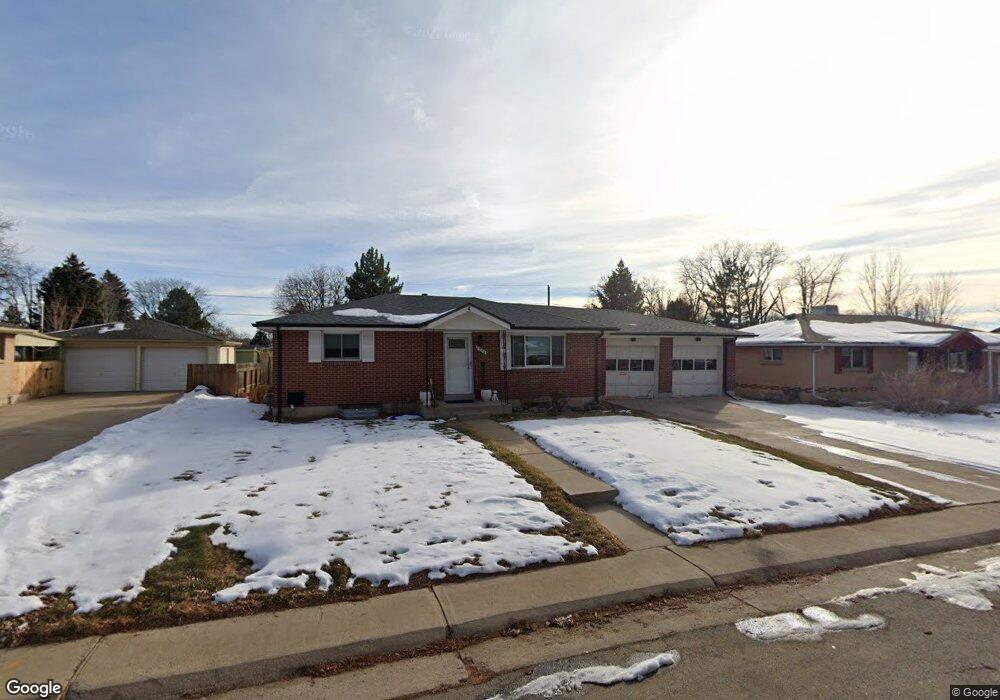
8330 Chase Way Arvada, CO 80003
Far Horizons NeighborhoodEstimated Value: $446,594 - $529,000
3
Beds
3
Baths
900
Sq Ft
$540/Sq Ft
Est. Value
About This Home
This home is located at 8330 Chase Way, Arvada, CO 80003 and is currently estimated at $485,899, approximately $539 per square foot. 8330 Chase Way is a home located in Jefferson County with nearby schools including Little Elementary School, Pomona High School, and Face School.
Ownership History
Date
Name
Owned For
Owner Type
Purchase Details
Closed on
Dec 2, 2016
Sold by
Brooks Russell W
Bought by
Heuer Jennifer L
Current Estimated Value
Home Financials for this Owner
Home Financials are based on the most recent Mortgage that was taken out on this home.
Original Mortgage
$252,000
Outstanding Balance
$199,359
Interest Rate
3.47%
Mortgage Type
New Conventional
Estimated Equity
$286,540
Purchase Details
Closed on
Sep 24, 2015
Sold by
Brooks Russell W and Brooks Russell W
Bought by
Brooks Russell W and Heuer Jennifer L
Home Financials for this Owner
Home Financials are based on the most recent Mortgage that was taken out on this home.
Original Mortgage
$220,600
Interest Rate
3.87%
Mortgage Type
VA
Purchase Details
Closed on
Aug 29, 2003
Sold by
Ehlers Shirley M
Bought by
Brooks Ii Russell W and Brooks Russell W
Home Financials for this Owner
Home Financials are based on the most recent Mortgage that was taken out on this home.
Original Mortgage
$192,381
Interest Rate
5.87%
Mortgage Type
FHA
Create a Home Valuation Report for This Property
The Home Valuation Report is an in-depth analysis detailing your home's value as well as a comparison with similar homes in the area
Home Values in the Area
Average Home Value in this Area
Purchase History
| Date | Buyer | Sale Price | Title Company |
|---|---|---|---|
| Heuer Jennifer L | -- | Stewart Title | |
| Brooks Russell W | -- | Stewart Title | |
| Brooks Ii Russell W | $195,400 | Title America |
Source: Public Records
Mortgage History
| Date | Status | Borrower | Loan Amount |
|---|---|---|---|
| Open | Heuer Jennifer L | $252,000 | |
| Previous Owner | Brooks Russell W | $220,600 | |
| Previous Owner | Brooks Ii Russell W | $192,381 |
Source: Public Records
Tax History
| Year | Tax Paid | Tax Assessment Tax Assessment Total Assessment is a certain percentage of the fair market value that is determined by local assessors to be the total taxable value of land and additions on the property. | Land | Improvement |
|---|---|---|---|---|
| 2024 | $2,630 | $27,113 | $11,654 | $15,459 |
| 2023 | $2,630 | $27,113 | $11,654 | $15,459 |
| 2022 | $2,284 | $23,323 | $7,766 | $15,557 |
| 2021 | $2,322 | $23,995 | $7,990 | $16,005 |
| 2020 | $2,159 | $22,375 | $7,245 | $15,130 |
| 2019 | $2,130 | $22,375 | $7,245 | $15,130 |
| 2018 | $1,831 | $18,704 | $5,792 | $12,912 |
| 2017 | $1,677 | $18,704 | $5,792 | $12,912 |
| 2016 | $1,535 | $16,127 | $6,233 | $9,894 |
| 2015 | $1,290 | $16,127 | $6,233 | $9,894 |
| 2014 | $1,290 | $12,744 | $5,572 | $7,172 |
Source: Public Records
Map
Nearby Homes
- 8250 Chase Way
- 5290 W 84th Ave
- 8181 Chase Way
- 8438 Ames St
- 8427 Eaton St
- 8126 Benton Way
- 8118 Benton Way
- 8090 Chase Dr
- 8536 Eaton St
- 8136 Gray Ct Unit 509
- 5435 W 86th Ave
- 5620 W 80th Place Unit 55
- 5620 W 80th Place Unit 74
- 5620 W 80th Place Unit 78
- 5620 W 80th Place Unit 66
- 5690 W 80th Place Unit 98
- 7980 Chase Cir Unit F
- 7994 Chase Cir Unit 20
- 7978 Chase Cir Unit B
- 7996 Chase Cir Unit 5
- 8320 Chase Way
- 8340 Chase Way
- 8327 Benton Way
- 8317 Benton Way
- 8329 Benton Way
- 8310 Chase Way
- 8350 Chase Way
- 8321 Chase Way
- 8331 Chase Way
- 8347 Benton Way
- 8309 Benton Way
- 8311 Chase Way
- 8341 Chase Way
- 8360 Chase Way
- 8300 Chase Way
- 8301 Chase Way
- 8349 Benton Way
- 8307 Benton Way
- 8343 Chase Way
- 8326 Benton Way
Your Personal Tour Guide
Ask me questions while you tour the home.