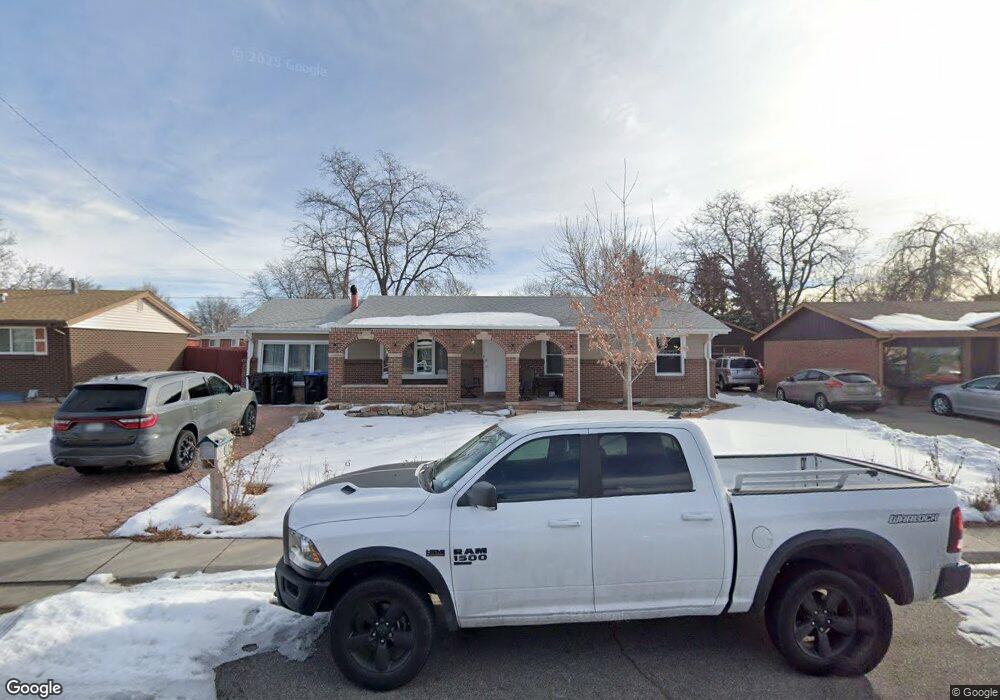
8332 Depew Way Arvada, CO 80003
Far Horizons NeighborhoodEstimated Value: $517,942 - $594,000
4
Beds
3
Baths
2,756
Sq Ft
$200/Sq Ft
Est. Value
About This Home
This home is located at 8332 Depew Way, Arvada, CO 80003 and is currently estimated at $550,486, approximately $199 per square foot. 8332 Depew Way is a home located in Jefferson County with nearby schools including Little Elementary School, Pomona High School, and Woodrow Wilson Academy.
Ownership History
Date
Name
Owned For
Owner Type
Purchase Details
Closed on
Nov 8, 2016
Sold by
Torres Jesse M and Matulik Michelle A
Bought by
Torres Jesse M and Torres Michelle A
Current Estimated Value
Home Financials for this Owner
Home Financials are based on the most recent Mortgage that was taken out on this home.
Original Mortgage
$213,675
Outstanding Balance
$170,246
Interest Rate
3.52%
Mortgage Type
FHA
Estimated Equity
$380,240
Purchase Details
Closed on
May 29, 2008
Sold by
Rodriguez Alex C and Rodriguez Karoline M
Bought by
Torres Jesse M and Matulik Michelle A
Home Financials for this Owner
Home Financials are based on the most recent Mortgage that was taken out on this home.
Original Mortgage
$189,094
Interest Rate
6.07%
Mortgage Type
FHA
Create a Home Valuation Report for This Property
The Home Valuation Report is an in-depth analysis detailing your home's value as well as a comparison with similar homes in the area
Home Values in the Area
Average Home Value in this Area
Purchase History
| Date | Buyer | Sale Price | Title Company |
|---|---|---|---|
| Torres Jesse M | -- | Cherry Creek Title Services | |
| Torres Jesse M | $202,600 | Security Title |
Source: Public Records
Mortgage History
| Date | Status | Borrower | Loan Amount |
|---|---|---|---|
| Open | Torres Jesse M | $213,675 | |
| Closed | Torres Jesse M | $189,094 |
Source: Public Records
Tax History
| Year | Tax Paid | Tax Assessment Tax Assessment Total Assessment is a certain percentage of the fair market value that is determined by local assessors to be the total taxable value of land and additions on the property. | Land | Improvement |
|---|---|---|---|---|
| 2024 | $3,111 | $32,074 | $11,535 | $20,539 |
| 2023 | $3,111 | $32,074 | $11,535 | $20,539 |
| 2022 | $2,568 | $26,220 | $7,688 | $18,532 |
| 2021 | $2,610 | $26,974 | $7,909 | $19,065 |
| 2020 | $2,387 | $24,733 | $7,171 | $17,562 |
| 2019 | $2,355 | $24,733 | $7,171 | $17,562 |
| 2018 | $2,070 | $21,145 | $5,733 | $15,412 |
| 2017 | $1,895 | $21,145 | $5,733 | $15,412 |
| 2016 | $1,856 | $19,502 | $6,233 | $13,269 |
| 2015 | $1,555 | $19,502 | $6,233 | $13,269 |
| 2014 | $1,555 | $15,355 | $5,572 | $9,783 |
Source: Public Records
Map
Nearby Homes
- 8250 Chase Way
- 8427 Eaton St
- 5290 W 84th Ave
- 8181 Chase Way
- 8438 Ames St
- 8126 Benton Way
- 8118 Benton Way
- 8536 Eaton St
- 8136 Gray Ct Unit 509
- 8090 Chase Dr
- 5435 W 86th Ave
- 5620 W 80th Place Unit 55
- 5620 W 80th Place Unit 74
- 5620 W 80th Place Unit 78
- 5620 W 80th Place Unit 66
- 5690 W 80th Place Unit 98
- 7994 Chase Cir Unit 20
- 7980 Chase Cir Unit F
- 7996 Chase Cir Unit 5
- 6138 W 85th Place
Your Personal Tour Guide
Ask me questions while you tour the home.