8341 W Sunset Blvd Unit 2 Los Angeles, CA 90069
Hollywood Hills West NeighborhoodEstimated Value: $744,000 - $1,015,000
2
Beds
2
Baths
1,220
Sq Ft
$717/Sq Ft
Est. Value
About This Home
This home is located at 8341 W Sunset Blvd Unit 2, Los Angeles, CA 90069 and is currently estimated at $875,298, approximately $717 per square foot. 8341 W Sunset Blvd Unit 2 is a home located in Los Angeles County with nearby schools including Gardner Street Elementary School, Hubert Howe Bancroft Middle School, and Fairfax High School.
Ownership History
Date
Name
Owned For
Owner Type
Purchase Details
Closed on
Mar 14, 2003
Sold by
Cooper William
Bought by
Hellyar Eric
Current Estimated Value
Home Financials for this Owner
Home Financials are based on the most recent Mortgage that was taken out on this home.
Original Mortgage
$440,000
Interest Rate
7.75%
Purchase Details
Closed on
Oct 9, 2002
Sold by
House Cynthia Gayle
Bought by
Cooper William and Hellyar Eric
Home Financials for this Owner
Home Financials are based on the most recent Mortgage that was taken out on this home.
Original Mortgage
$388,000
Interest Rate
7.37%
Purchase Details
Closed on
Aug 18, 2000
Sold by
Sorrow Jerry W and Sorrow Pamela B
Bought by
House Cynthia Gayle
Home Financials for this Owner
Home Financials are based on the most recent Mortgage that was taken out on this home.
Original Mortgage
$305,750
Interest Rate
7.98%
Create a Home Valuation Report for This Property
The Home Valuation Report is an in-depth analysis detailing your home's value as well as a comparison with similar homes in the area
Home Values in the Area
Average Home Value in this Area
Purchase History
| Date | Buyer | Sale Price | Title Company |
|---|---|---|---|
| Hellyar Eric | -- | Equity Title Company | |
| Cooper William | $485,000 | Equity Title Company | |
| House Cynthia Gayle | $385,000 | Chicago Title Insurance |
Source: Public Records
Mortgage History
| Date | Status | Borrower | Loan Amount |
|---|---|---|---|
| Previous Owner | Hellyar Eric | $440,000 | |
| Previous Owner | Cooper William | $388,000 | |
| Previous Owner | House Cynthia Gayle | $305,750 | |
| Closed | House Cynthia Gayle | $60,000 | |
| Closed | Cooper William | $72,750 | |
| Closed | Hellyar Eric | $110,000 |
Source: Public Records
Tax History Compared to Growth
Tax History
| Year | Tax Paid | Tax Assessment Tax Assessment Total Assessment is a certain percentage of the fair market value that is determined by local assessors to be the total taxable value of land and additions on the property. | Land | Improvement |
|---|---|---|---|---|
| 2025 | $8,532 | $702,420 | $318,624 | $383,796 |
| 2024 | $8,532 | $688,648 | $312,377 | $376,271 |
| 2023 | $8,372 | $675,146 | $306,252 | $368,894 |
| 2022 | $8,015 | $661,909 | $300,248 | $361,661 |
| 2021 | $7,913 | $648,931 | $294,361 | $354,570 |
| 2019 | $7,612 | $629,685 | $285,631 | $344,054 |
| 2018 | $7,536 | $617,339 | $280,031 | $337,308 |
| 2016 | $7,172 | $593,369 | $269,158 | $324,211 |
| 2015 | $7,067 | $584,457 | $265,115 | $319,342 |
| 2014 | $7,093 | $573,009 | $259,922 | $313,087 |
Source: Public Records
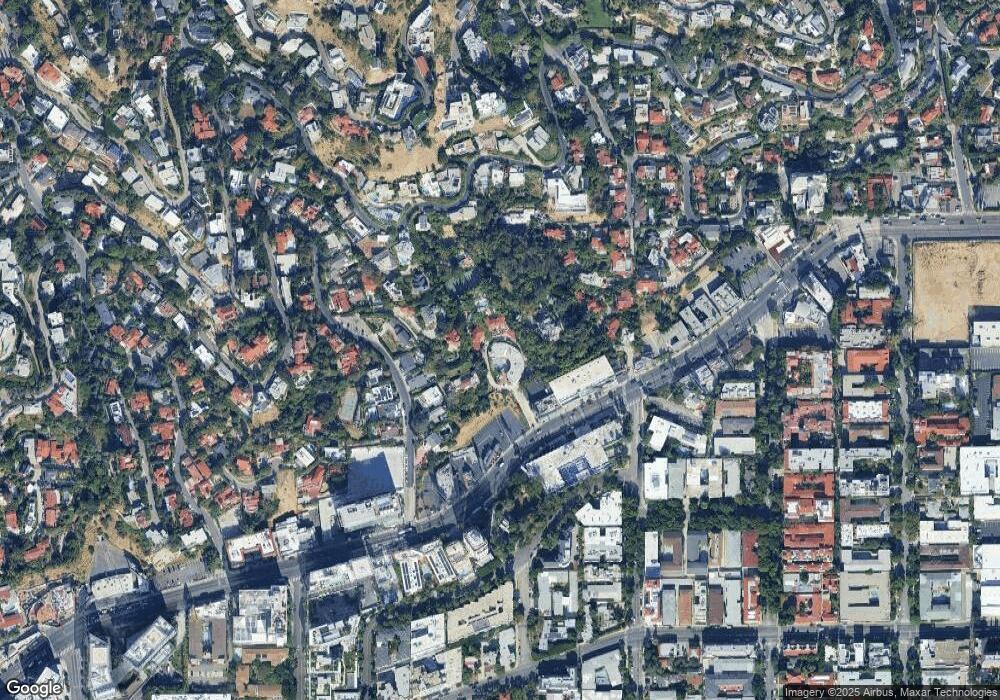
Map
Nearby Homes
- 8428 Hollywood Blvd
- 8404 Franklin Ave
- 8417 Harold Way
- 1531 Marmont Ave
- 8272 Marmont Ln
- 1400 N Sweetzer Ave Unit 106
- 8411 Hollywood Blvd
- 8450 Carlton Way
- 8400 De Longpre Ave Unit 104
- 8249 Marmont Ln
- 8420 W Sunset Blvd Unit 108
- 8420 W Sunset Blvd Unit 307
- 8353 Sunset View Dr
- 8526 Hollywood Blvd
- 8572 Hillside Ave
- 1414 N Harper Ave Unit 4
- 8448 Franklin Ave
- 1417 Queens Rd
- 8558 Hollywood Blvd
- 8265 Fountain Ave Unit 302
- 8341 W Sunset Blvd Unit 7
- 8341 W Sunset Blvd Unit 6
- 8341 W Sunset Blvd Unit 5
- 8341 W Sunset Blvd Unit 4
- 8341 W Sunset Blvd Unit 3
- 8341 W Sunset Blvd Unit 1
- 8339 W Sunset Blvd
- 1438 N Kings Rd
- 1486 N Sweetzer Ave
- 8343 W Sunset Blvd
- 1462 N Kings Rd
- 1432 N Kings Rd
- 1440 N Kings Rd
- 1424 N Kings Rd
- 1446 N Kings Rd
- 1464 N Kings Rd
- 1475 N Sweetzer Ave
- 1416 N Kings Rd
- 1416 N Kings Rd
- 1466 N Sweetzer Ave