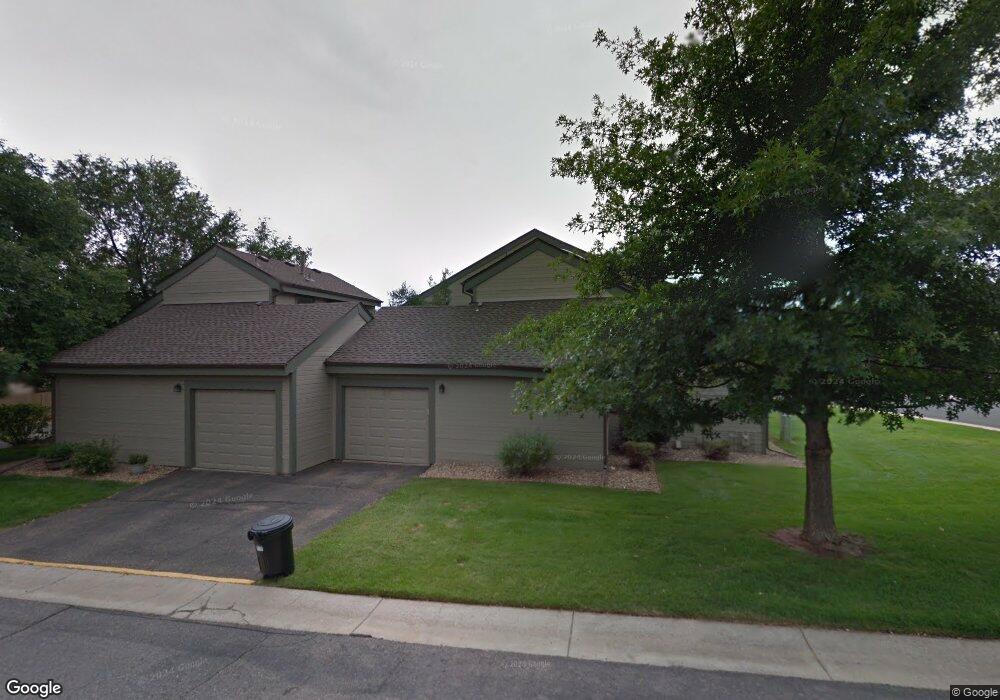
8344 S Everett Way Unit A Littleton, CO 80128
Meadowbrook Heights NeighborhoodEstimated Value: $379,575 - $412,000
2
Beds
2
Baths
1,108
Sq Ft
$354/Sq Ft
Est. Value
About This Home
This home is located at 8344 S Everett Way Unit A, Littleton, CO 80128 and is currently estimated at $391,894, approximately $353 per square foot. 8344 S Everett Way Unit A is a home located in Jefferson County with nearby schools including Mortensen Elementary School, Falcon Bluffs Middle School, and Chatfield High School.
Ownership History
Date
Name
Owned For
Owner Type
Purchase Details
Closed on
Aug 31, 2011
Sold by
Tillett John
Bought by
Jackson Dolores A
Current Estimated Value
Purchase Details
Closed on
Jul 31, 2002
Sold by
Hanne Norman and Hanne Ingrid
Bought by
Tillett John
Home Financials for this Owner
Home Financials are based on the most recent Mortgage that was taken out on this home.
Original Mortgage
$130,400
Interest Rate
6.62%
Purchase Details
Closed on
Nov 30, 1998
Sold by
Fries Jeri L
Bought by
Hanne Norman and Hanne Ingrid
Purchase Details
Closed on
Sep 26, 1996
Sold by
Hamilton Danny L
Bought by
Fries Jeri L
Home Financials for this Owner
Home Financials are based on the most recent Mortgage that was taken out on this home.
Original Mortgage
$78,000
Interest Rate
7.96%
Mortgage Type
FHA
Create a Home Valuation Report for This Property
The Home Valuation Report is an in-depth analysis detailing your home's value as well as a comparison with similar homes in the area
Home Values in the Area
Average Home Value in this Area
Purchase History
| Date | Buyer | Sale Price | Title Company |
|---|---|---|---|
| Jackson Dolores A | $136,500 | Land Title Guarantee Company | |
| Tillett John | $163,000 | Land Title | |
| Hanne Norman | $109,900 | -- | |
| Fries Jeri L | $94,000 | -- |
Source: Public Records
Mortgage History
| Date | Status | Borrower | Loan Amount |
|---|---|---|---|
| Previous Owner | Tillett John | $130,400 | |
| Previous Owner | Fries Jeri L | $78,000 |
Source: Public Records
Tax History Compared to Growth
Tax History
| Year | Tax Paid | Tax Assessment Tax Assessment Total Assessment is a certain percentage of the fair market value that is determined by local assessors to be the total taxable value of land and additions on the property. | Land | Improvement |
|---|---|---|---|---|
| 2024 | $1,421 | $21,207 | $6,030 | $15,177 |
| 2023 | $1,421 | $21,207 | $6,030 | $15,177 |
| 2022 | $1,177 | $18,748 | $4,170 | $14,578 |
| 2021 | $1,894 | $19,288 | $4,290 | $14,998 |
| 2020 | $1,760 | $17,963 | $4,290 | $13,673 |
| 2019 | $1,738 | $17,963 | $4,290 | $13,673 |
| 2018 | $1,577 | $15,744 | $3,600 | $12,144 |
| 2017 | $1,440 | $15,744 | $3,600 | $12,144 |
| 2016 | $1,332 | $14,057 | $3,184 | $10,873 |
| 2015 | $1,074 | $14,057 | $3,184 | $10,873 |
| 2014 | $1,074 | $10,627 | $2,229 | $8,398 |
Source: Public Records
Map
Nearby Homes
- 8414 S Everett Way Unit F
- 8424 S Everett Way Unit F
- 9051 W Phillips Dr
- 8329 S Carr Way Unit 2
- 9199 W Phillips Dr
- 9617 W Chatfield Ave Unit E
- 8376 S Garland Way
- 9667 W Chatfield Ave Unit D
- 9613 W Chatfield Ave Unit F
- 9643 W Chatfield Ave Unit D
- 9661 W Chatfield Ave Unit B
- 9602 W Chatfield Ave Unit E
- 8309 S Independence Cir Unit 203
- 8369 S Independence Cir Unit 305
- 8456 S Hoyt Way Unit 301
- 9709 W Chatfield Ave Unit A
- 8358 S Independence Cir Unit 105
- 9715 W Chatfield Ave Unit E
- 9632 W Chatfield Ave Unit C
- 9557 W San Juan Cir Unit 207
- 8344 S Everett Way Unit F
- 8344 S Everett Way Unit E
- 8344 S Everett Way Unit D
- 8344 S Everett Way Unit C
- 8344 S Everett Way Unit B
- 8344 S Everett Way
- 8354 S Everett Way Unit F
- 8354 S Everett Way Unit E
- 8354 S Everett Way Unit D
- 8354 S Everett Way Unit B
- 9003 W Coco Dr
- 9004 W Coco Dr
- 8324 S Everett Way Unit H
- 8324 S Everett Way Unit G
- 8324 S Everett Way Unit F
- 8324 S Everett Way Unit E
- 8324 S Everett Way Unit D
- 8324 S Everett Way Unit C
- 8324 S Everett Way Unit B
- 8324 S Everett Way Unit A