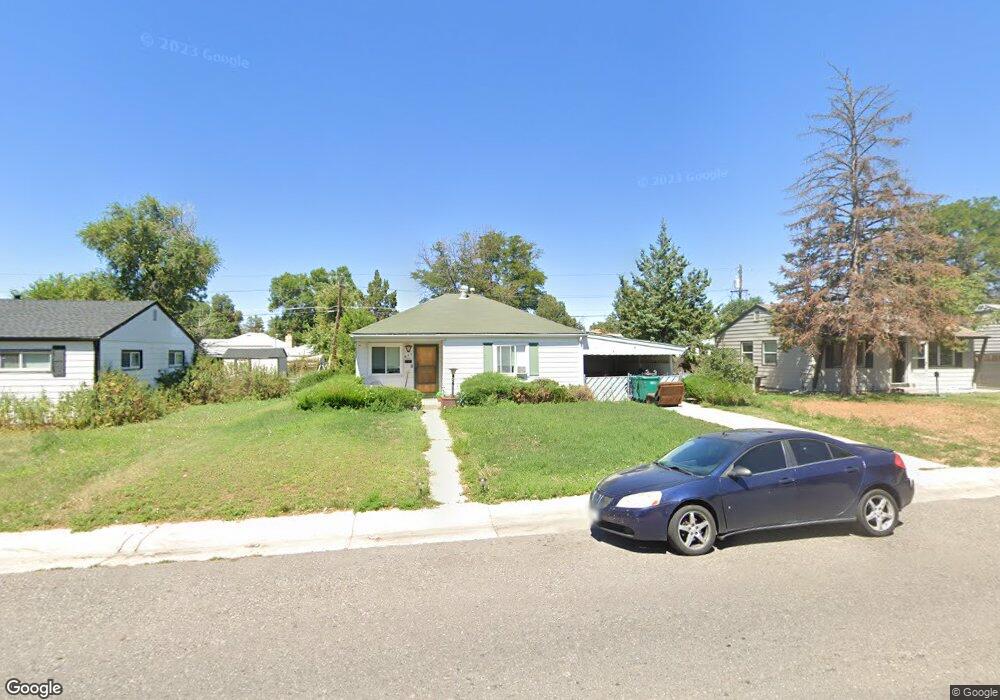
835 Moline St Aurora, CO 80010
Del Mar Parkway NeighborhoodEstimated Value: $297,000 - $339,000
2
Beds
1
Bath
736
Sq Ft
$433/Sq Ft
Est. Value
About This Home
This home is located at 835 Moline St, Aurora, CO 80010 and is currently estimated at $318,468, approximately $432 per square foot. 835 Moline St is a home located in Arapahoe County with nearby schools including Kenton Elementary School, North Middle School Health Sciences & Technology, and Aurora Central High School.
Ownership History
Date
Name
Owned For
Owner Type
Purchase Details
Closed on
Sep 16, 2015
Sold by
Parish Shannon
Bought by
Building Assets Llc
Current Estimated Value
Purchase Details
Closed on
Aug 20, 2010
Sold by
Youmans Marie E
Bought by
Parish Shannon
Home Financials for this Owner
Home Financials are based on the most recent Mortgage that was taken out on this home.
Original Mortgage
$72,800
Interest Rate
4.6%
Mortgage Type
New Conventional
Purchase Details
Closed on
Jul 4, 1776
Bought by
Conversion Arapco
Create a Home Valuation Report for This Property
The Home Valuation Report is an in-depth analysis detailing your home's value as well as a comparison with similar homes in the area
Home Values in the Area
Average Home Value in this Area
Purchase History
| Date | Buyer | Sale Price | Title Company |
|---|---|---|---|
| Building Assets Llc | -- | None Available | |
| Parish Shannon | $91,000 | Capital Title Llc | |
| Conversion Arapco | -- | -- |
Source: Public Records
Mortgage History
| Date | Status | Borrower | Loan Amount |
|---|---|---|---|
| Previous Owner | Parish Shannon | $72,800 |
Source: Public Records
Tax History
| Year | Tax Paid | Tax Assessment Tax Assessment Total Assessment is a certain percentage of the fair market value that is determined by local assessors to be the total taxable value of land and additions on the property. | Land | Improvement |
|---|---|---|---|---|
| 2025 | $2,068 | $21,313 | -- | -- |
| 2024 | $2,006 | $21,581 | -- | -- |
| 2023 | $2,006 | $21,581 | $0 | $0 |
| 2022 | $1,895 | $18,877 | $0 | $0 |
| 2021 | $1,957 | $18,877 | $0 | $0 |
| 2020 | $1,823 | $17,511 | $0 | $0 |
| 2019 | $1,813 | $17,511 | $0 | $0 |
| 2018 | $1,549 | $14,645 | $0 | $0 |
| 2017 | $1,347 | $14,645 | $0 | $0 |
| 2016 | $1,000 | $10,643 | $0 | $0 |
| 2015 | $965 | $10,643 | $0 | $0 |
| 2014 | $732 | $7,769 | $0 | $0 |
| 2013 | -- | $6,230 | $0 | $0 |
Source: Public Records
Map
Nearby Homes
Your Personal Tour Guide
Ask me questions while you tour the home.