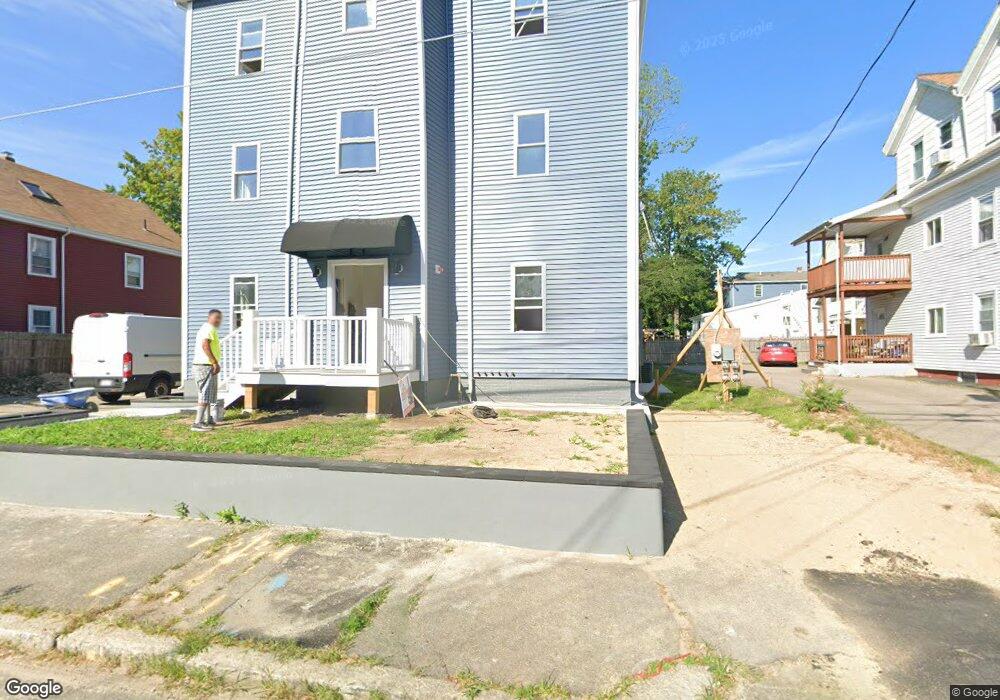
835 Montello St Unit 2 Brockton, MA 02301
Clifton Heights NeighborhoodEstimated Value: $196,000 - $810,000
4
Beds
1
Bath
1,000
Sq Ft
$444/Sq Ft
Est. Value
About This Home
This home is located at 835 Montello St Unit 2, Brockton, MA 02301 and is currently estimated at $443,598, approximately $443 per square foot. 835 Montello St Unit 2 is a home located in Plymouth County with nearby schools including Davis K-8 School, John F. Kennedy Elementary School, and South Middle School.
Ownership History
Date
Name
Owned For
Owner Type
Purchase Details
Closed on
Sep 13, 2023
Sold by
Su Xueyan
Bought by
Teixeira David
Current Estimated Value
Purchase Details
Closed on
Oct 31, 2013
Sold by
Mingles Mark
Bought by
Su Xueyan
Home Financials for this Owner
Home Financials are based on the most recent Mortgage that was taken out on this home.
Original Mortgage
$217,600
Interest Rate
4.52%
Mortgage Type
Commercial
Purchase Details
Closed on
Apr 6, 2007
Sold by
835 Montello Rt and Reed
Bought by
Mingels Mark
Home Financials for this Owner
Home Financials are based on the most recent Mortgage that was taken out on this home.
Original Mortgage
$202,500
Interest Rate
6.25%
Mortgage Type
Commercial
Purchase Details
Closed on
Oct 24, 1991
Sold by
Sweet George M
Bought by
Comfed Sb Fa
Purchase Details
Closed on
Aug 10, 1987
Sold by
Barry Patrick R
Bought by
Sweet George M
Home Financials for this Owner
Home Financials are based on the most recent Mortgage that was taken out on this home.
Original Mortgage
$159,900
Interest Rate
10.37%
Mortgage Type
Commercial
Create a Home Valuation Report for This Property
The Home Valuation Report is an in-depth analysis detailing your home's value as well as a comparison with similar homes in the area
Home Values in the Area
Average Home Value in this Area
Purchase History
| Date | Buyer | Sale Price | Title Company |
|---|---|---|---|
| Teixeira David | $380,000 | None Available | |
| Teixeira David | $380,000 | None Available | |
| Su Xueyan | $290,000 | -- | |
| Su Xueyan | $290,000 | -- | |
| Mingels Mark | $270,000 | -- | |
| Mingels Mark | $270,000 | -- | |
| Comfed Sb Fa | $198,700 | -- | |
| Sweet George M | $199,900 | -- |
Source: Public Records
Mortgage History
| Date | Status | Borrower | Loan Amount |
|---|---|---|---|
| Previous Owner | Su Xueyan | $217,600 | |
| Previous Owner | Sweet George M | $202,500 | |
| Previous Owner | Sweet George M | $159,900 |
Source: Public Records
Tax History Compared to Growth
Tax History
| Year | Tax Paid | Tax Assessment Tax Assessment Total Assessment is a certain percentage of the fair market value that is determined by local assessors to be the total taxable value of land and additions on the property. | Land | Improvement |
|---|---|---|---|---|
| 2025 | $1,226 | $101,200 | $101,200 | $0 |
| 2024 | $1,216 | $101,200 | $101,200 | $0 |
| 2023 | $7,596 | $585,200 | $96,600 | $488,600 |
| 2022 | $7,570 | $541,900 | $96,600 | $445,300 |
| 2021 | $6,844 | $472,000 | $92,000 | $380,000 |
| 2020 | $7,142 | $471,400 | $111,300 | $360,100 |
| 2019 | $5,731 | $368,800 | $111,300 | $257,500 |
| 2018 | $5,749 | $358,000 | $111,300 | $246,700 |
| 2017 | $5,094 | $316,400 | $111,300 | $205,100 |
| 2016 | $4,897 | $282,100 | $111,290 | $170,810 |
| 2015 | $5,120 | $282,100 | $111,290 | $170,810 |
| 2014 | $3,989 | $220,000 | $70,100 | $149,900 |
Source: Public Records
Map
Nearby Homes
- 835 Montello St
- 827 Montello St
- 847 Montello St
- 24 E Nilsson St
- 21 Grand St
- 823 Montello St
- 832 Montello St
- 832 Montello St Unit 1
- 832 Montello St Unit 2
- 832 Montello St Unit 3
- 842 Montello St
- 19 Grand St
- 830 Montello St
- 20 E Nilsson St
- 848 Montello St
- 17 Grand St Unit 1
- 17 Grand St Unit 3
- 17 Grand St
- 17 Grand St Unit 2
- 17 Grand St Unit 1,2,3