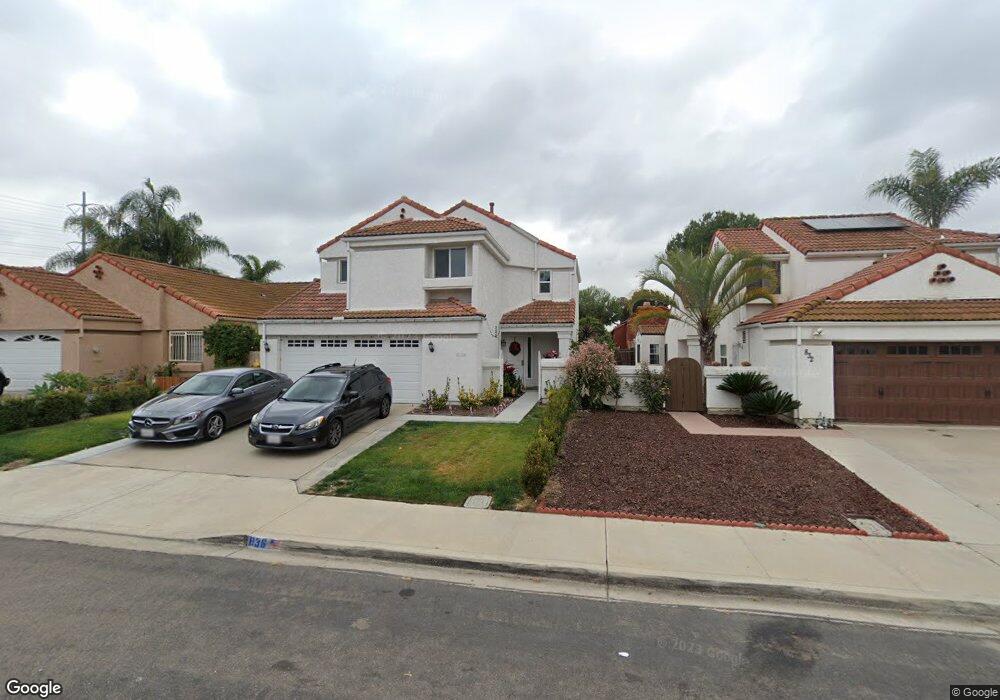
836 Cedarbend Way Chula Vista, CA 91910
Rancho Del Rey NeighborhoodEstimated Value: $827,825 - $917,000
3
Beds
3
Baths
1,562
Sq Ft
$563/Sq Ft
Est. Value
About This Home
This home is located at 836 Cedarbend Way, Chula Vista, CA 91910 and is currently estimated at $878,956, approximately $562 per square foot. 836 Cedarbend Way is a home located in San Diego County with nearby schools including Casillas Elementary School, Rancho Del Rey Middle School, and Otay Ranch Senior High School.
Ownership History
Date
Name
Owned For
Owner Type
Purchase Details
Closed on
Oct 2, 2015
Sold by
Welling Lynn E and Patricia Welling M
Bought by
Welling Family Trust
Current Estimated Value
Purchase Details
Closed on
Nov 3, 1999
Sold by
Schneider Jeffrey P and Schneider Laura L
Bought by
Welling Lynn E
Home Financials for this Owner
Home Financials are based on the most recent Mortgage that was taken out on this home.
Original Mortgage
$172,000
Outstanding Balance
$52,791
Interest Rate
7.82%
Estimated Equity
$826,165
Purchase Details
Closed on
Jan 23, 1998
Sold by
Sun Vera N
Bought by
Schneider Jeffrey P and Schneider Laura L
Home Financials for this Owner
Home Financials are based on the most recent Mortgage that was taken out on this home.
Original Mortgage
$183,804
Interest Rate
7.06%
Mortgage Type
VA
Purchase Details
Closed on
Nov 20, 1996
Sold by
Sun Vera N
Bought by
Sun Vera
Purchase Details
Closed on
Feb 13, 1996
Sold by
Sun Peter P and Sun Vera N
Bought by
Sun Vera N
Purchase Details
Closed on
Mar 10, 1989
Purchase Details
Closed on
Mar 5, 1985
Create a Home Valuation Report for This Property
The Home Valuation Report is an in-depth analysis detailing your home's value as well as a comparison with similar homes in the area
Home Values in the Area
Average Home Value in this Area
Purchase History
| Date | Buyer | Sale Price | Title Company |
|---|---|---|---|
| Welling Family Trust | -- | None Available | |
| Welling Lynn E | $215,000 | Commonwealth Land Title Co | |
| Schneider Jeffrey P | $180,500 | Lawyers Title | |
| Sun Vera | -- | -- | |
| Sun Vera N | -- | -- | |
| -- | $179,000 | -- | |
| -- | $116,500 | -- |
Source: Public Records
Mortgage History
| Date | Status | Borrower | Loan Amount |
|---|---|---|---|
| Open | Welling Lynn E | $172,000 | |
| Previous Owner | Schneider Jeffrey P | $183,804 |
Source: Public Records
Tax History Compared to Growth
Tax History
| Year | Tax Paid | Tax Assessment Tax Assessment Total Assessment is a certain percentage of the fair market value that is determined by local assessors to be the total taxable value of land and additions on the property. | Land | Improvement |
|---|---|---|---|---|
| 2025 | $4,006 | $330,423 | $119,183 | $211,240 |
| 2024 | $4,006 | $323,946 | $116,847 | $207,099 |
| 2023 | $3,948 | $317,595 | $114,556 | $203,039 |
| 2022 | $3,834 | $311,368 | $112,310 | $199,058 |
| 2021 | $3,748 | $305,263 | $110,108 | $195,155 |
| 2020 | $3,661 | $302,133 | $108,979 | $193,154 |
| 2019 | $3,568 | $296,210 | $106,843 | $189,367 |
| 2018 | $3,511 | $290,403 | $104,749 | $185,654 |
| 2017 | $3,438 | $284,710 | $102,696 | $182,014 |
| 2016 | $3,350 | $279,129 | $100,683 | $178,446 |
| 2015 | $3,303 | $274,937 | $99,171 | $175,766 |
| 2014 | $3,237 | $269,552 | $97,229 | $172,323 |
Source: Public Records
Map
Nearby Homes
- 1029 Vista Oak Place
- 820 Chervil Ct
- 1002 Cholla Place
- 694 Calma Place
- 1008 Calma Dr
- 1057 Paseo Del Norte
- 843 Calle Ciela Vista Unit 20
- 1060 Via Sinuoso
- 1112 Camino Del Rey
- 626 Mariposa Cir
- 640 E J St
- 713 Esla Dr
- 728 Cardona Ave
- 793 Vada St Unit 2
- 578 Nantucket Dr
- 1337 Santa Olivia Rd
- 491 Nanette St
- 486 E Naples St
- 554 Telegraph Canyon Rd Unit F
- 548 Telegraph Canyon Rd Unit D
- 838 Cedarbend Way
- 832 Cedarbend Way
- 830 Cedarbend Way
- 943 Redbud Rd Unit B
- 1004 Beechglen Dr Unit 8
- 941 Redbud Rd
- 1006 Beechglen Dr
- 945 Redbud Rd
- 828 Cedarbend Way
- 939 Redbud Rd
- 1008 Beechglen Dr
- 835 Cedarbend Way
- 937 Redbud Rd
- 833 Cedarbend Way
- 837 Cedarbend Way Unit B
- 826 Cedarbend Way
- 831 Cedarbend Way
- 1010 Beechglen Dr
- 839 Cedarbend Way
- 829 Cedarbend Way Unit B