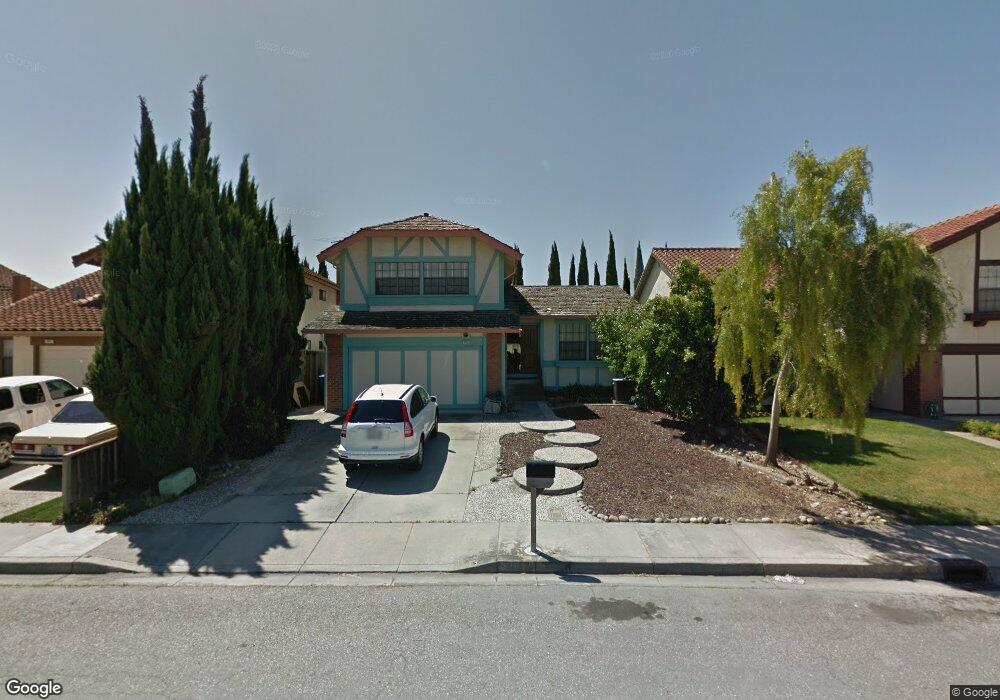
836 Las Lomas Dr Milpitas, CA 95035
Estimated Value: $2,099,000 - $2,281,000
4
Beds
3
Baths
2,183
Sq Ft
$990/Sq Ft
Est. Value
About This Home
This home is located at 836 Las Lomas Dr, Milpitas, CA 95035 and is currently estimated at $2,160,143, approximately $989 per square foot. 836 Las Lomas Dr is a home located in Santa Clara County with nearby schools including Anthony Spangler Elementary School, Thomas Russell Middle School, and Milpitas High School.
Ownership History
Date
Name
Owned For
Owner Type
Purchase Details
Closed on
Apr 2, 2003
Sold by
Vu Maclong T
Bought by
Vu Maclong T and Nguyen Sophie
Current Estimated Value
Home Financials for this Owner
Home Financials are based on the most recent Mortgage that was taken out on this home.
Original Mortgage
$291,000
Interest Rate
5.6%
Mortgage Type
Purchase Money Mortgage
Purchase Details
Closed on
Aug 18, 1999
Sold by
Liang Wen H and Yueh Guey L
Bought by
Vu Phai Tien and Vu Tram Ngoc
Home Financials for this Owner
Home Financials are based on the most recent Mortgage that was taken out on this home.
Original Mortgage
$305,900
Interest Rate
6.5%
Purchase Details
Closed on
Feb 3, 1994
Sold by
Liu Ming Biann and Liang Yola Y
Bought by
Liang Wen Hsiung and Liang Yueh Guey Lin
Home Financials for this Owner
Home Financials are based on the most recent Mortgage that was taken out on this home.
Original Mortgage
$203,150
Interest Rate
7.1%
Create a Home Valuation Report for This Property
The Home Valuation Report is an in-depth analysis detailing your home's value as well as a comparison with similar homes in the area
Home Values in the Area
Average Home Value in this Area
Purchase History
| Date | Buyer | Sale Price | Title Company |
|---|---|---|---|
| Vu Maclong T | -- | Fidelity National Title Ins | |
| Vu Maclong T | $194,000 | Fidelity National Title Ins | |
| Vu Phai Tien | $437,000 | Financial Title Company | |
| Liang Wen Hsiung | -- | Gateway Title Company |
Source: Public Records
Mortgage History
| Date | Status | Borrower | Loan Amount |
|---|---|---|---|
| Closed | Vu Maclong T | $291,000 | |
| Closed | Vu Phai Tien | $305,900 | |
| Previous Owner | Liang Wen Hsiung | $203,150 |
Source: Public Records
Tax History Compared to Growth
Tax History
| Year | Tax Paid | Tax Assessment Tax Assessment Total Assessment is a certain percentage of the fair market value that is determined by local assessors to be the total taxable value of land and additions on the property. | Land | Improvement |
|---|---|---|---|---|
| 2025 | $7,791 | $671,258 | $302,005 | $369,253 |
| 2024 | $7,791 | $658,097 | $296,084 | $362,013 |
| 2023 | $7,766 | $645,194 | $290,279 | $354,915 |
| 2022 | $7,736 | $632,544 | $284,588 | $347,956 |
| 2021 | $7,625 | $620,142 | $279,008 | $341,134 |
| 2020 | $7,493 | $613,785 | $276,148 | $337,637 |
| 2019 | $7,409 | $601,751 | $270,734 | $331,017 |
| 2018 | $7,038 | $589,953 | $265,426 | $324,527 |
| 2017 | $6,948 | $578,386 | $260,222 | $318,164 |
| 2016 | $6,667 | $567,046 | $255,120 | $311,926 |
| 2015 | $6,600 | $558,529 | $251,288 | $307,241 |
| 2014 | $6,421 | $547,589 | $246,366 | $301,223 |
Source: Public Records
Map
Nearby Homes
- 800 Los Positos Dr
- 253 Park Hill Dr
- 685 Parvin Dr
- 521 Topham Ct
- 1000 Jacklin Rd
- 830 Aaron Park Dr
- 350 Hearst Dr
- 773 Heflin St
- 1084 N Hillview Dr
- 496 Dempsey Rd Unit 199
- 1501 Canton Dr
- 559 Bayview Park Dr
- 484 Dempsey Rd Unit 185
- 7280 Marylinn Dr
- 0 Railroad Ave
- 17 Terfidia Ln
- 7 Crystal Ct
- 99 Jacklin Ct
- 207 Redwood Ave
- 1209 Glacier Dr
- 828 Las Lomas Dr
- 844 Las Lomas Dr
- 820 Las Lomas Dr
- 852 Las Lomas Dr
- 839 Pacheco Dr
- 855 Pacheco Dr
- 831 Pacheco Dr
- 837 Las Lomas Dr
- 812 Las Lomas Dr
- 865 Pacheco Dr
- 829 Las Lomas Dr
- 860 Las Lomas Dr
- 845 Las Lomas Dr
- 823 Pacheco Dr
- 821 Las Lomas Dr
- 853 Las Lomas Dr
- 871 Pacheco Dr
- 804 Las Lomas Dr
- 815 Pacheco Dr
- 868 Las Lomas Dr