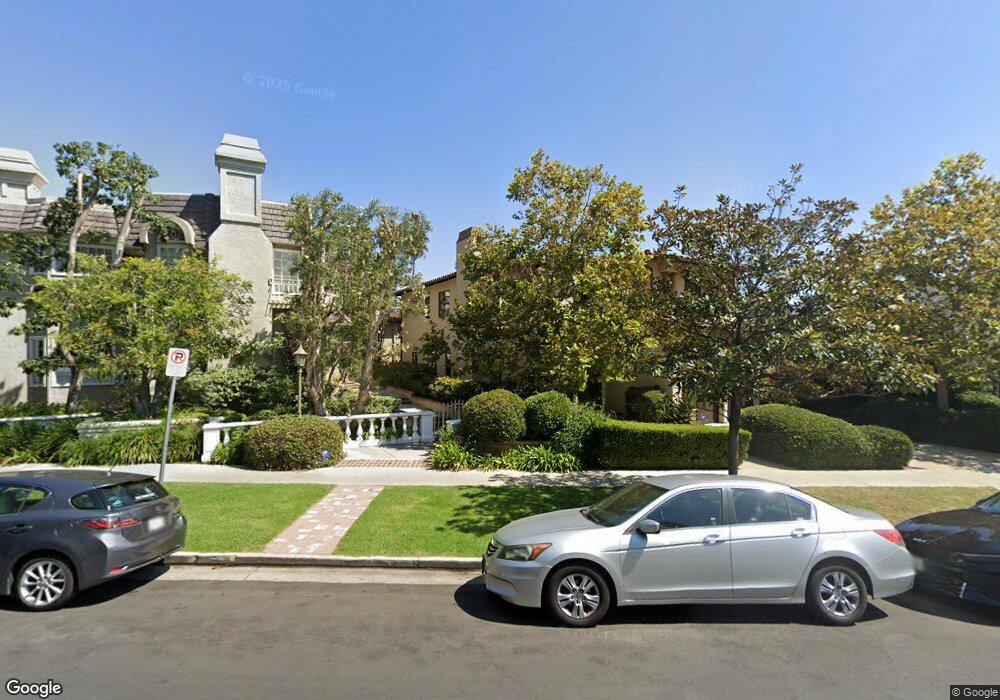
836 S Gretna Green Way Unit 2 Los Angeles, CA 90049
Brentwood NeighborhoodEstimated Value: $2,618,709 - $3,290,000
4
Beds
3
Baths
2,999
Sq Ft
$954/Sq Ft
Est. Value
About This Home
This home is located at 836 S Gretna Green Way Unit 2, Los Angeles, CA 90049 and is currently estimated at $2,860,903, approximately $953 per square foot. 836 S Gretna Green Way Unit 2 is a home located in Los Angeles County with nearby schools including Brentwood Science Magnet, Brockton Avenue Elementary School, and Paul Revere Charter Middle School.
Ownership History
Date
Name
Owned For
Owner Type
Purchase Details
Closed on
Mar 24, 2016
Sold by
Shapiro Zak
Bought by
Sapozhnikov Igor and Sapozhnikov Brooklyn Levine
Current Estimated Value
Home Financials for this Owner
Home Financials are based on the most recent Mortgage that was taken out on this home.
Original Mortgage
$1,511,250
Outstanding Balance
$1,153,602
Interest Rate
2.62%
Mortgage Type
Adjustable Rate Mortgage/ARM
Estimated Equity
$1,707,301
Purchase Details
Closed on
Jul 13, 2007
Sold by
Shapiro Zak
Bought by
Shapiro Zak and Shapiro Elina
Purchase Details
Closed on
Apr 10, 2007
Sold by
Foley Development Inc
Bought by
Shapiro Zak W
Home Financials for this Owner
Home Financials are based on the most recent Mortgage that was taken out on this home.
Original Mortgage
$234,600
Interest Rate
6.11%
Mortgage Type
Credit Line Revolving
Create a Home Valuation Report for This Property
The Home Valuation Report is an in-depth analysis detailing your home's value as well as a comparison with similar homes in the area
Home Values in the Area
Average Home Value in this Area
Purchase History
| Date | Buyer | Sale Price | Title Company |
|---|---|---|---|
| Sapozhnikov Igor | $2,015,000 | Equity Title Company | |
| Shapiro Zak | -- | None Available | |
| Shapiro Zak W | $1,575,000 | First American Title Co | |
| Shapiro Zak W | -- | First American Title Co |
Source: Public Records
Mortgage History
| Date | Status | Borrower | Loan Amount |
|---|---|---|---|
| Open | Sapozhnikov Igor | $1,511,250 | |
| Previous Owner | Shapiro Zak W | $234,600 | |
| Previous Owner | Shapiro Zak W | $1,125,000 |
Source: Public Records
Tax History Compared to Growth
Tax History
| Year | Tax Paid | Tax Assessment Tax Assessment Total Assessment is a certain percentage of the fair market value that is determined by local assessors to be the total taxable value of land and additions on the property. | Land | Improvement |
|---|---|---|---|---|
| 2025 | $28,360 | $2,385,346 | $1,528,043 | $857,303 |
| 2024 | $28,360 | $2,338,576 | $1,498,082 | $840,494 |
| 2023 | $27,807 | $2,292,722 | $1,468,708 | $824,014 |
| 2022 | $26,506 | $2,247,767 | $1,439,910 | $807,857 |
| 2021 | $26,179 | $2,203,694 | $1,411,677 | $792,017 |
| 2019 | $25,388 | $2,138,332 | $1,369,806 | $768,526 |
| 2018 | $25,252 | $2,096,405 | $1,342,948 | $753,457 |
| 2017 | $24,698 | $2,055,300 | $1,316,616 | $738,684 |
| 2016 | $21,462 | $1,782,536 | $1,108,908 | $673,628 |
| 2015 | $21,145 | $1,755,762 | $1,092,252 | $663,510 |
| 2014 | $21,206 | $1,721,370 | $1,070,857 | $650,513 |
Source: Public Records
Map
Nearby Homes
- 853 S Bundy Dr
- 12218 Montana Ave Unit 103
- 12218 Montana Ave Unit 302
- 11965 Gorham Ave Unit 503
- 836 S Bundy Dr Unit 300
- 11970 Montana Ave Unit 108
- 11970 Montana Ave Unit 207
- 11939 Gorham Ave Unit 103
- 12302 Gorham Ave
- 11952 Darlington Ave Unit 6
- 880 Wellesley Ave
- 864 Wellesley Ave
- 11923 Darlington Ave Unit 302
- 11974 Mayfield Ave Unit 2
- 11974 Mayfield Ave Unit 6
- 11974 Mayfield Ave Unit 1
- 11954 Mayfield Ave Unit 3
- 11919 Mayfield Ave Unit 2
- 11840 Dorothy St Unit 202
- 11847 Gorham Ave Unit 410
- 836 S Gretna Green Way
- 838 S Gretna Green Way
- 842 S Gretna Green Way
- 848 S Gretna Green Way
- 820 S Gretna Green Way Unit 8
- 820 S Gretna Green Way Unit 6
- 820 S Gretna Green Way Unit 5
- 820 S Gretna Green Way Unit 4
- 820 S Gretna Green Way Unit 3
- 820 S Gretna Green Way Unit 2
- 820 S Gretna Green Way Unit 1
- 850 S Gretna Green Way
- 856 S Gretna Green Way
- 854 S Gretna Green Way Unit 1
- 865 S Bundy Dr Unit 1/2
- 859 S Bundy Dr Unit 105
- 865 S Bundy Dr
- 859 S Bundy Dr
- 849 S Bundy Dr
- 845 S Bundy Dr