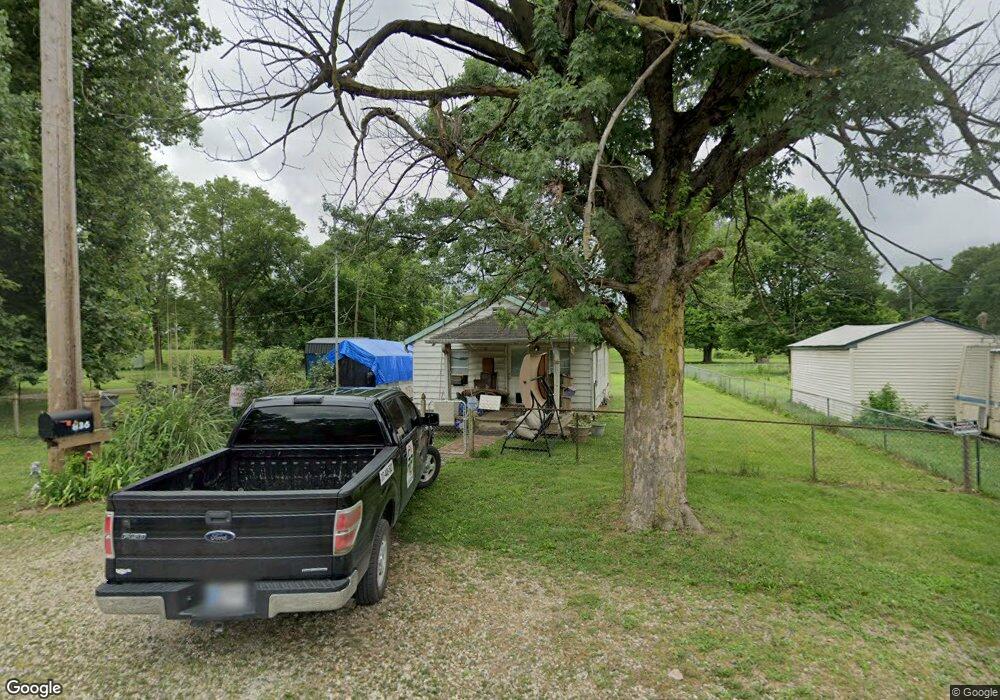
836 Sadie St Indianapolis, IN 46221
West Indianapolis NeighborhoodEstimated Value: $72,608 - $117,000
1
Bed
--
Bath
550
Sq Ft
$175/Sq Ft
Est. Value
About This Home
This home is located at 836 Sadie St, Indianapolis, IN 46221 and is currently estimated at $96,402, approximately $175 per square foot. 836 Sadie St is a home located in Marion County with nearby schools including William Penn School 49, Eleanor Skillen School No. 34, and Ralph Waldo Emerson School 58.
Ownership History
Date
Name
Owned For
Owner Type
Purchase Details
Closed on
Nov 5, 2021
Sold by
Bab Shake & Bake Llc
Bought by
Simple Quarters Llc
Current Estimated Value
Purchase Details
Closed on
Sep 8, 2021
Sold by
Meacham Dale E and Martin Margaret A
Bought by
Shake & Bake Llc
Purchase Details
Closed on
Aug 19, 2021
Sold by
Meacham Dale E and Martin Margaret A
Bought by
Shake & Bake Llc
Purchase Details
Closed on
Aug 10, 2021
Sold by
Shake & Bake Llc
Bought by
Simple Quarters Llc
Purchase Details
Closed on
Sep 15, 2020
Sold by
Douglas E Meacham Living Trust and Meacham Dale E
Bought by
Meacham Dale E and Martin Margaret A
Purchase Details
Closed on
Apr 1, 2020
Sold by
Meacham Trust
Bought by
Meacham Dale E and Martin Margaret A
Purchase Details
Closed on
Jan 13, 2014
Sold by
Meacham Crystal P and Meacham Douglas E
Bought by
Douglas E Meacham Living Trust
Create a Home Valuation Report for This Property
The Home Valuation Report is an in-depth analysis detailing your home's value as well as a comparison with similar homes in the area
Home Values in the Area
Average Home Value in this Area
Purchase History
| Date | Buyer | Sale Price | Title Company |
|---|---|---|---|
| Simple Quarters Llc | -- | Bray Miranda D | |
| Shake & Bake Llc | -- | Bray Miranda D | |
| Homes Mission | $30,000 | None Available | |
| Shake & Bake Llc | -- | None Listed On Document | |
| Simple Quarters Llc | $40,000 | None Available | |
| Shake & Bake Llc | $40,000 | None Available | |
| Meacham Dale E | -- | None Listed On Document | |
| Meacham Dale E | -- | None Available | |
| Douglas E Meacham Living Trust | -- | None Available |
Source: Public Records
Tax History Compared to Growth
Tax History
| Year | Tax Paid | Tax Assessment Tax Assessment Total Assessment is a certain percentage of the fair market value that is determined by local assessors to be the total taxable value of land and additions on the property. | Land | Improvement |
|---|---|---|---|---|
| 2024 | $560 | $21,500 | $4,200 | $17,300 |
| 2023 | $560 | $20,700 | $4,200 | $16,500 |
| 2022 | $526 | $19,400 | $4,200 | $15,200 |
| 2021 | $481 | $17,800 | $4,200 | $13,600 |
| 2020 | $489 | $18,100 | $4,200 | $13,900 |
| 2019 | $496 | $18,100 | $4,200 | $13,900 |
| 2018 | $446 | $15,900 | $4,200 | $11,700 |
| 2017 | $450 | $18,100 | $4,200 | $13,900 |
| 2016 | $430 | $17,600 | $4,200 | $13,400 |
| 2014 | $372 | $17,000 | $4,200 | $12,800 |
| 2013 | $396 | $17,600 | $4,200 | $13,400 |
Source: Public Records
Map
Nearby Homes
- 827 Corrill St
- 819 Corrill St
- 813 Corrill St
- 3247 W Morris St
- 414 S Warman Ave
- 302 S Warman Ave
- 464 S Exeter Ave
- 435 S Exeter Ave
- 215 S Warman Ave
- 833 S Tremont St
- 428 S Exeter Ave
- 1049 S Tremont St
- 435 S Rochester Ave
- 2918 Jackson St
- 2331 W Morris St
- 1123 S Pershing Ave
- 1003 S Sheffield Ave
- 23 S Holmes Ave
- 1049 S Sheffield Ave
- 2110 W Mccarty St