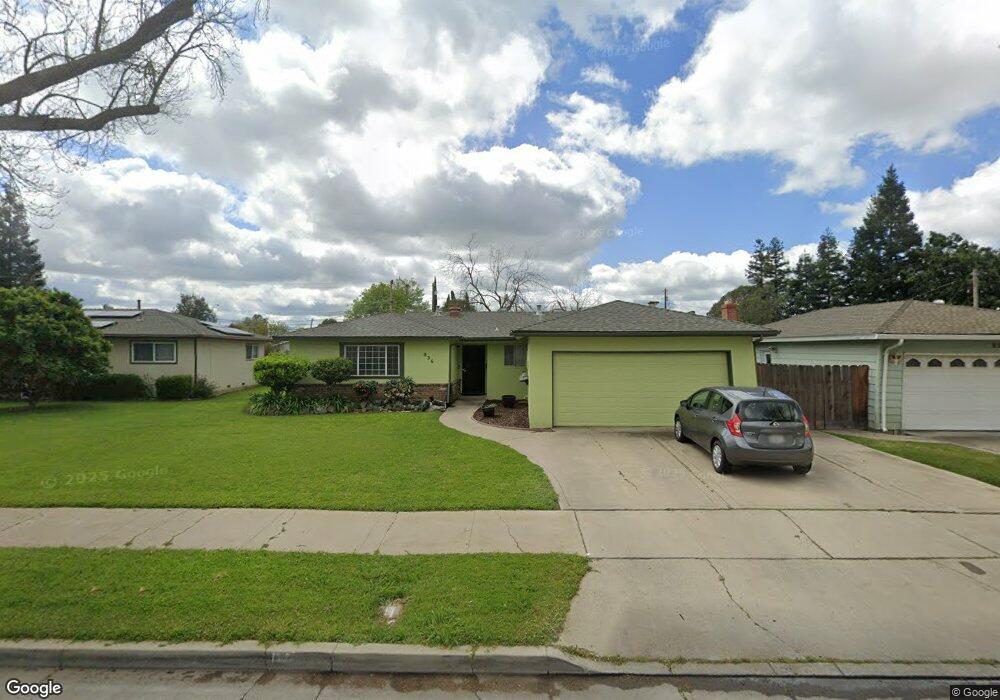
836 Seneca St Merced, CA 95340
North Merced NeighborhoodEstimated Value: $349,000 - $363,000
3
Beds
2
Baths
1,474
Sq Ft
$243/Sq Ft
Est. Value
About This Home
This home is located at 836 Seneca St, Merced, CA 95340 and is currently estimated at $357,911, approximately $242 per square foot. 836 Seneca St is a home located in Merced County with nearby schools including Donn B. Chenoweth Elementary School, Herbert H. Cruickshank Middle School, and Merced High School.
Ownership History
Date
Name
Owned For
Owner Type
Purchase Details
Closed on
Aug 10, 2007
Sold by
Villa Henry X
Bought by
Villa Sandra G
Current Estimated Value
Purchase Details
Closed on
May 2, 2006
Sold by
Va
Bought by
Villa Henry X and Villa Sandra G
Home Financials for this Owner
Home Financials are based on the most recent Mortgage that was taken out on this home.
Original Mortgage
$95,000
Interest Rate
6.29%
Mortgage Type
Fannie Mae Freddie Mac
Purchase Details
Closed on
Sep 13, 2002
Sold by
Villa Henry X
Bought by
Villa Sandra G and Villa Henry X
Create a Home Valuation Report for This Property
The Home Valuation Report is an in-depth analysis detailing your home's value as well as a comparison with similar homes in the area
Home Values in the Area
Average Home Value in this Area
Purchase History
| Date | Buyer | Sale Price | Title Company |
|---|---|---|---|
| Villa Sandra G | -- | None Available | |
| Villa Henry X | -- | Alliance Title Company | |
| Villa Sandra G | -- | -- |
Source: Public Records
Mortgage History
| Date | Status | Borrower | Loan Amount |
|---|---|---|---|
| Closed | Villa Henry X | $95,000 |
Source: Public Records
Tax History
| Year | Tax Paid | Tax Assessment Tax Assessment Total Assessment is a certain percentage of the fair market value that is determined by local assessors to be the total taxable value of land and additions on the property. | Land | Improvement |
|---|---|---|---|---|
| 2025 | $1,680 | $166,166 | $68,939 | $97,227 |
| 2024 | $1,680 | $162,909 | $67,588 | $95,321 |
| 2023 | $1,655 | $159,715 | $66,263 | $93,452 |
| 2022 | $1,631 | $156,584 | $64,964 | $91,620 |
| 2021 | $1,626 | $153,515 | $63,691 | $89,824 |
| 2020 | $1,637 | $151,941 | $63,038 | $88,903 |
| 2019 | $1,611 | $148,962 | $61,802 | $87,160 |
| 2018 | $1,467 | $146,042 | $60,591 | $85,451 |
| 2017 | $1,521 | $143,179 | $59,403 | $83,776 |
| 2016 | $1,496 | $140,373 | $58,239 | $82,134 |
| 2015 | $1,471 | $138,266 | $57,365 | $80,901 |
| 2014 | $1,438 | $135,559 | $56,242 | $79,317 |
Source: Public Records
Map
Nearby Homes
- 822 Seneca St
- 3009 Colony Park Dr
- 439 E Olive Ave
- 544 Seminole Dr
- 3045 Silver Elm Ct
- 3125 El Capitan Ave
- 3216 El Capitan Ave
- 3191 El Capitan Ave
- 892 Amador Ct
- 891 Hansen Ave
- 1056 E Alexander Ave
- 2971 Chestnut Ave
- 3221 Dublin Ave
- 1366 E Alexander Ave
- 27 Emerald Dr
- 688 Elise Ct
- 3317 Shamrock Ave
- 1282 Carolina Dr
- 3332 Shamrock Place
- 1611 E Olive Ave
Your Personal Tour Guide
Ask me questions while you tour the home.