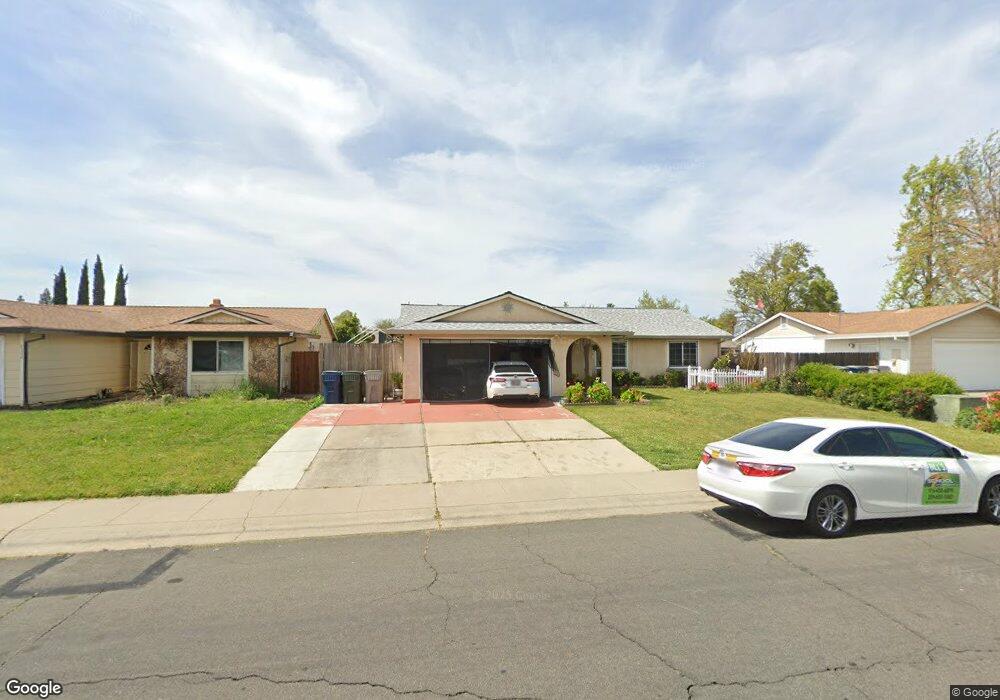
8362 Langtree Way Sacramento, CA 95823
North Laguna NeighborhoodEstimated Value: $429,000 - $431,922
4
Beds
2
Baths
1,307
Sq Ft
$329/Sq Ft
Est. Value
About This Home
This home is located at 8362 Langtree Way, Sacramento, CA 95823 and is currently estimated at $430,481, approximately $329 per square foot. 8362 Langtree Way is a home located in Sacramento County with nearby schools including John Reith Elementary School, Samuel Jackman Middle School, and Valley High School.
Ownership History
Date
Name
Owned For
Owner Type
Purchase Details
Closed on
Jan 26, 2004
Sold by
Cervantes Rochelle V
Bought by
Chandra Suresh and Chandra Anilasha L
Current Estimated Value
Home Financials for this Owner
Home Financials are based on the most recent Mortgage that was taken out on this home.
Original Mortgage
$202,500
Outstanding Balance
$94,774
Interest Rate
5.8%
Mortgage Type
Purchase Money Mortgage
Estimated Equity
$335,707
Purchase Details
Closed on
Dec 15, 2003
Sold by
Edu Jeremias A and Edu Jeremias
Bought by
Cervantes Rochelle J
Home Financials for this Owner
Home Financials are based on the most recent Mortgage that was taken out on this home.
Original Mortgage
$202,500
Outstanding Balance
$94,774
Interest Rate
5.8%
Mortgage Type
Purchase Money Mortgage
Estimated Equity
$335,707
Purchase Details
Closed on
Feb 5, 2003
Sold by
Panag Bernardita E
Bought by
Edu Jeremias
Purchase Details
Closed on
Jan 9, 2003
Sold by
Panag Benjamin Sagaysay
Bought by
Edu Jeremias
Create a Home Valuation Report for This Property
The Home Valuation Report is an in-depth analysis detailing your home's value as well as a comparison with similar homes in the area
Home Values in the Area
Average Home Value in this Area
Purchase History
| Date | Buyer | Sale Price | Title Company |
|---|---|---|---|
| Chandra Suresh | $562,500 | Alliance Title Company | |
| Cervantes Rochelle J | -- | Alliance Title Company | |
| Cervantes Rochelle J | -- | Alliance Title Company | |
| Edu Jeremias | -- | -- | |
| Edu Jeremias | -- | -- |
Source: Public Records
Mortgage History
| Date | Status | Borrower | Loan Amount |
|---|---|---|---|
| Open | Chandra Suresh | $202,500 | |
| Previous Owner | Cervantes Rochelle J | $166,500 |
Source: Public Records
Tax History
| Year | Tax Paid | Tax Assessment Tax Assessment Total Assessment is a certain percentage of the fair market value that is determined by local assessors to be the total taxable value of land and additions on the property. | Land | Improvement |
|---|---|---|---|---|
| 2025 | $5,073 | $319,883 | $71,078 | $248,805 |
| 2024 | $5,073 | $313,612 | $69,685 | $243,927 |
| 2023 | $3,367 | $307,464 | $68,319 | $239,145 |
| 2022 | $3,319 | $301,436 | $66,980 | $234,456 |
| 2021 | $3,270 | $295,526 | $65,667 | $229,859 |
| 2020 | $3,219 | $292,497 | $64,994 | $227,503 |
| 2019 | $3,157 | $286,763 | $63,720 | $223,043 |
| 2018 | $3,068 | $281,141 | $62,471 | $218,670 |
| 2017 | $3,005 | $275,630 | $61,247 | $214,383 |
| 2016 | $2,858 | $270,227 | $60,047 | $210,180 |
| 2015 | $2,794 | $266,169 | $59,146 | $207,023 |
| 2014 | $2,582 | $243,978 | $54,215 | $189,763 |
Source: Public Records
Map
Nearby Homes
- 8366 Langtree Way
- 2 Cismont Ct
- 8420 Sunblaze Way
- 8515 Gibbs Way
- 5912 Sawyer Cir
- 8248 Sunbird Way
- 6279 Dayspring Way
- 8153 La Almendra Way
- 8504 Sunnybrae Dr
- 5012 Wuthering Ave
- 251 Cinema St
- 8264 Center Pkwy Unit 104
- 8252 Pkwy Unit 79
- 6400 Sunnyfield Way
- 197 Cinema St
- 8584 Sunnybrae Dr
- 5931 Sternsburg Way
- 8501 Center Pkwy
- 8568 Derlin Way
- 7992 Valley Green Dr
- 8364 Langtree Way
- 8360 Langtree Way
- 8363 Langtree Way
- 8361 Langtree Way
- 8368 Langtree Way
- 8359 Langtree Way
- 8356 Langtree Way
- 2 Tearpak Ct
- 8357 Langtree Way
- 8359 Lancraft Dr
- 8370 Langtree Way
- 9 Tearpak Ct
- 6 Tearpak Ct
- 8348 Langtree Way
- 33 Tearpak Ct
- 5800 Stubblefield Way
- 8379 Langtree Way
- 8355 Lancraft Dr
- 10 Tearpak Ct
- 8372 Langtree Way
Your Personal Tour Guide
Ask me questions while you tour the home.