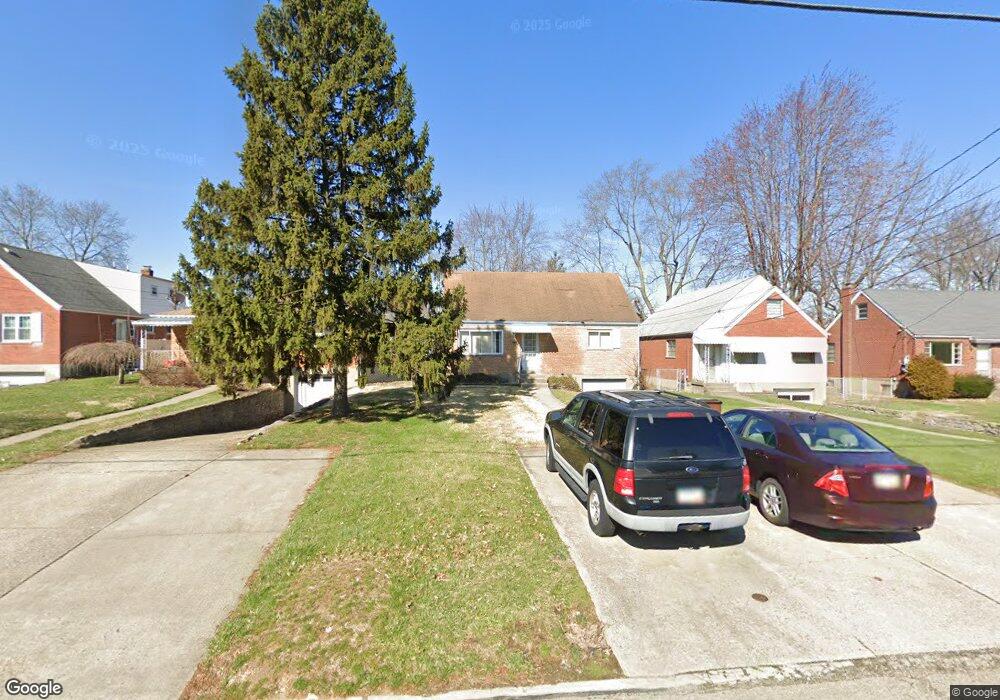
8365 Bobolink Ave Cincinnati, OH 45231
Estimated Value: $218,000 - $283,000
3
Beds
2
Baths
1,485
Sq Ft
$169/Sq Ft
Est. Value
About This Home
This home is located at 8365 Bobolink Ave, Cincinnati, OH 45231 and is currently estimated at $250,800, approximately $168 per square foot. 8365 Bobolink Ave is a home located in Hamilton County with nearby schools including North College Hill Elementary School, North College Hill Middle School, and North College Hill High School.
Ownership History
Date
Name
Owned For
Owner Type
Purchase Details
Closed on
May 17, 2024
Sold by
Harman Mae and Harman Greg
Bought by
Wilmont Victoria L and Helm Jerry A
Current Estimated Value
Home Financials for this Owner
Home Financials are based on the most recent Mortgage that was taken out on this home.
Original Mortgage
$230,743
Outstanding Balance
$227,508
Interest Rate
6.88%
Mortgage Type
FHA
Estimated Equity
$23,292
Purchase Details
Closed on
Aug 15, 2023
Sold by
Sheriff Of Hamilton County Ohio
Bought by
Harman Mae
Purchase Details
Closed on
Jun 28, 1996
Sold by
Dewald James Clarence and Dewald Mary A
Bought by
Lear Peter F and Lear Yolanda
Home Financials for this Owner
Home Financials are based on the most recent Mortgage that was taken out on this home.
Original Mortgage
$82,076
Interest Rate
8.07%
Create a Home Valuation Report for This Property
The Home Valuation Report is an in-depth analysis detailing your home's value as well as a comparison with similar homes in the area
Home Values in the Area
Average Home Value in this Area
Purchase History
| Date | Buyer | Sale Price | Title Company |
|---|---|---|---|
| Wilmont Victoria L | $235,000 | None Listed On Document | |
| Harman Mae | $124,000 | None Listed On Document | |
| Lear Peter F | $81,500 | -- |
Source: Public Records
Mortgage History
| Date | Status | Borrower | Loan Amount |
|---|---|---|---|
| Open | Wilmont Victoria L | $230,743 | |
| Previous Owner | Lear Peter F | $82,076 |
Source: Public Records
Tax History Compared to Growth
Tax History
| Year | Tax Paid | Tax Assessment Tax Assessment Total Assessment is a certain percentage of the fair market value that is determined by local assessors to be the total taxable value of land and additions on the property. | Land | Improvement |
|---|---|---|---|---|
| 2024 | $2,563 | $50,670 | $7,084 | $43,586 |
| 2023 | $2,864 | $50,670 | $7,084 | $43,586 |
| 2022 | $2,330 | $32,589 | $5,355 | $27,234 |
| 2021 | $2,693 | $32,589 | $5,355 | $27,234 |
| 2020 | $2,001 | $32,589 | $5,355 | $27,234 |
| 2019 | $1,963 | $28,585 | $4,697 | $23,888 |
| 2018 | $1,964 | $28,585 | $4,697 | $23,888 |
| 2017 | $1,857 | $28,585 | $4,697 | $23,888 |
| 2016 | $1,735 | $28,305 | $6,370 | $21,935 |
| 2015 | $1,738 | $28,305 | $6,370 | $21,935 |
| 2014 | $1,736 | $28,305 | $6,370 | $21,935 |
| 2013 | $1,791 | $30,111 | $6,776 | $23,335 |
Source: Public Records
Map
Nearby Homes
- 8579 Daly Rd
- 7929 Cherrywood Ct
- 8543 Foxcroft Dr
- 7923 Bobolink Dr
- 1280 Brushwood Ave
- 8681 Desoto Dr
- 8772 Balboa Dr
- 1478 Foxwood Dr
- 8584 Mockingbird Ln
- 8627 Mockingbird Ln
- 6832 Tarawa Dr
- 1029 Bluejay Dr
- 1116 Madeleine Cir
- 1025 Eastgate Dr
- 8840 Grenada Dr
- 8622 Mockingbird Ln
- 6765 Richard Ave
- 1544 W Galbraith Rd
- 8663 Mockingbird Ln
- 8831 Daly Rd
- 8365 Bobolink Dr
- 8371 Bobolink Ave
- 8357 Bobolink Ave
- 8357 Bobolink Dr
- 8377 Bobolink Dr
- 8351 Bobolink Ave
- 8377 Bobolink Ave
- 8345 Bobolink Ave
- 8364 Carrol Ave
- 8364 Carrol Ave Unit 115
- 8383 Bobolink Ave
- 8356 Carrol Ave
- 8356 Carrol Ave Unit 116
- 8370 Carrol Ave
- 8370 Carrol Ave Unit 114
- 8350 Carrol Ave
- 8350 Carrol Ave Unit 117
- 8376 Carrol Ave
- 8376 Carrol Ave Unit 113
- 8337 Bobolink Ave