Estimated Value: $392,000 - $483,000
2
Beds
1
Bath
1,032
Sq Ft
$432/Sq Ft
Est. Value
About This Home
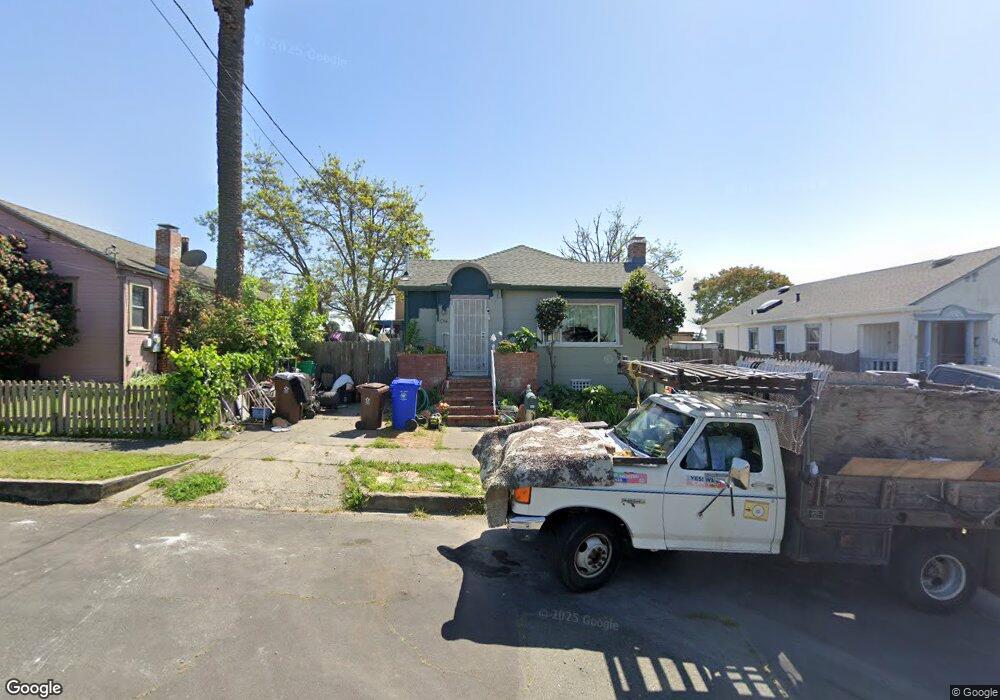
This home is located at 837 1st St, Rodeo, CA 94572 and is currently estimated at $445,488, approximately $431 per square foot. 837 1st St is a home located in Contra Costa County with nearby schools including Rodeo Hills Elementary School, Carquinez Middle School, and John Swett High School.
Ownership History
Date
Name
Owned For
Owner Type
Purchase Details
Closed on
Oct 16, 2014
Sold by
Savela John
Bought by
Grappo Don and Anderson Dezarea
Current Estimated Value
Purchase Details
Closed on
Oct 4, 2007
Sold by
Chrisman Sheryl
Bought by
Savela John
Purchase Details
Closed on
Jul 18, 2007
Sold by
Chu Shirley
Bought by
Savela John
Purchase Details
Closed on
Jul 13, 2007
Sold by
Savela Karen
Bought by
Savela John
Purchase Details
Closed on
Sep 22, 2006
Sold by
Savela Marjorie
Bought by
Savela John and Savela John
Purchase Details
Closed on
Nov 20, 2000
Sold by
Savela John and Savela Marjorie
Bought by
Savela John and Savela John
Home Financials for this Owner
Home Financials are based on the most recent Mortgage that was taken out on this home.
Original Mortgage
$145,000
Interest Rate
7.86%
Mortgage Type
Stand Alone First
Create a Home Valuation Report for This Property
The Home Valuation Report is an in-depth analysis detailing your home's value as well as a comparison with similar homes in the area
Home Values in the Area
Average Home Value in this Area
Purchase History
| Date | Buyer | Sale Price | Title Company |
|---|---|---|---|
| Grappo Don | $225,000 | Chicago Title Company | |
| Savela John | -- | None Available | |
| Savela John | -- | None Available | |
| Savela John | -- | None Available | |
| Savela John | -- | None Available | |
| Savela John | -- | Financial Title Company |
Source: Public Records
Mortgage History
| Date | Status | Borrower | Loan Amount |
|---|---|---|---|
| Previous Owner | Savela John | $145,000 |
Source: Public Records
Tax History
| Year | Tax Paid | Tax Assessment Tax Assessment Total Assessment is a certain percentage of the fair market value that is determined by local assessors to be the total taxable value of land and additions on the property. | Land | Improvement |
|---|---|---|---|---|
| 2025 | $6,268 | $270,403 | $162,242 | $108,161 |
| 2024 | $5,845 | $265,102 | $159,061 | $106,041 |
| 2023 | $5,845 | $259,905 | $155,943 | $103,962 |
| 2022 | $5,576 | $254,810 | $152,886 | $101,924 |
| 2021 | $5,487 | $249,815 | $149,889 | $99,926 |
| 2019 | $5,356 | $242,408 | $145,445 | $96,963 |
| 2018 | $5,238 | $237,656 | $142,594 | $95,062 |
| 2017 | $5,139 | $232,998 | $139,799 | $93,199 |
| 2016 | $4,800 | $228,430 | $137,058 | $91,372 |
| 2015 | $4,769 | $225,000 | $135,000 | $90,000 |
| 2014 | $3,817 | $149,000 | $91,712 | $57,288 |
Source: Public Records
Map
Nearby Homes
- 729 1st St
- 220 Vaqueros Ave
- 1027 3rd St
- 205 Pacific Ave Unit 213
- 139 Rodeo Ave
- 511 Third St
- 229 Lake Ave
- 343 Rodeo Ave
- 1334 7th St
- 601 Napa Ave
- 11 Fallen Leaf Ct
- 1012 Rock Harbor Point
- 836 Hawthorne Dr
- 106 White Cap Cove
- 1012 Salt Spray Terrace
- 900 Seascape Cir
- 834 Coral Ridge Cir
- 797 Coral Ridge Cir
- 1101 Chelsea
- 120 Bonita Ct
Your Personal Tour Guide
Ask me questions while you tour the home.