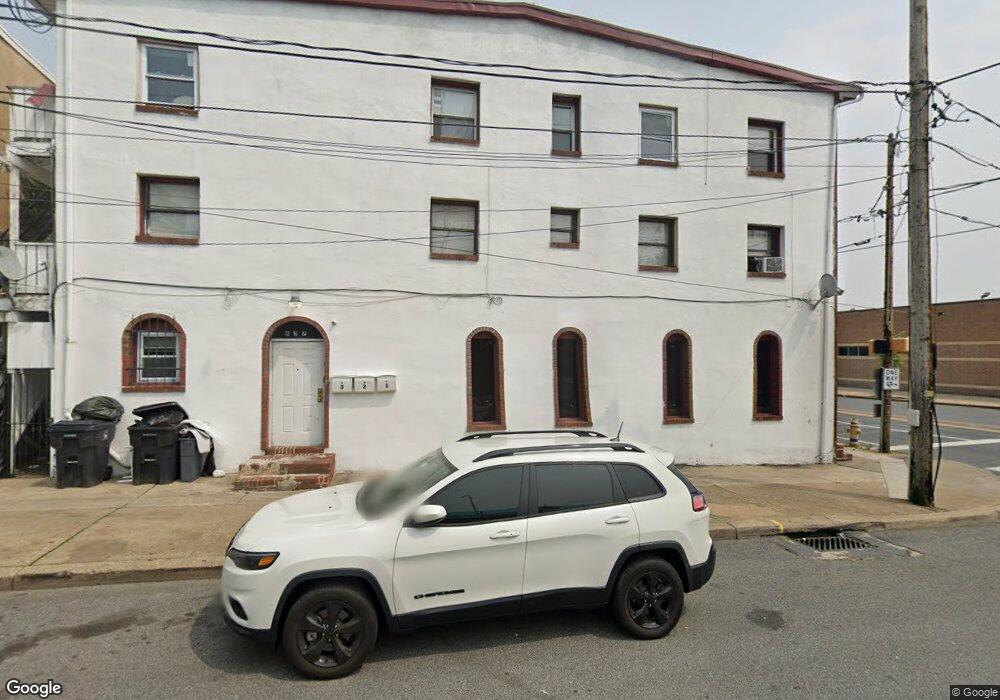
837 W 4th St Wilmington, DE 19801
Downtown Wilmington NeighborhoodEstimated Value: $261,694
--
Bed
--
Bath
2,268
Sq Ft
$115/Sq Ft
Est. Value
About This Home
This home is located at 837 W 4th St, Wilmington, DE 19801 and is currently estimated at $261,694, approximately $115 per square foot. 837 W 4th St is a home located in New Castle County with nearby schools including The Bancroft School, The Bayard School, and Newark High School.
Ownership History
Date
Name
Owned For
Owner Type
Purchase Details
Closed on
Dec 20, 2021
Sold by
Provey Powell Jr
Bought by
Parsons Helaine
Current Estimated Value
Home Financials for this Owner
Home Financials are based on the most recent Mortgage that was taken out on this home.
Original Mortgage
$127,500
Outstanding Balance
$117,172
Interest Rate
3.05%
Mortgage Type
New Conventional
Estimated Equity
$144,522
Purchase Details
Closed on
Feb 12, 1992
Bought by
Powell Provey
Create a Home Valuation Report for This Property
The Home Valuation Report is an in-depth analysis detailing your home's value as well as a comparison with similar homes in the area
Home Values in the Area
Average Home Value in this Area
Purchase History
| Date | Buyer | Sale Price | Title Company |
|---|---|---|---|
| Parsons Helaine | $170,000 | None Listed On Document | |
| Powell Provey | $52,000 | -- |
Source: Public Records
Mortgage History
| Date | Status | Borrower | Loan Amount |
|---|---|---|---|
| Open | Parsons Helaine | $127,500 |
Source: Public Records
Tax History Compared to Growth
Tax History
| Year | Tax Paid | Tax Assessment Tax Assessment Total Assessment is a certain percentage of the fair market value that is determined by local assessors to be the total taxable value of land and additions on the property. | Land | Improvement |
|---|---|---|---|---|
| 2024 | $2,120 | $57,500 | $2,200 | $55,300 |
| 2023 | $2,074 | $57,500 | $2,200 | $55,300 |
| 2022 | $2,045 | $57,500 | $2,200 | $55,300 |
| 2021 | $1,993 | $57,500 | $2,200 | $55,300 |
| 2020 | $0 | $57,500 | $2,200 | $55,300 |
| 2019 | $2,830 | $57,500 | $2,200 | $55,300 |
| 2018 | $60 | $57,500 | $2,200 | $55,300 |
| 2017 | $1,067 | $57,500 | $2,200 | $55,300 |
| 2016 | $1,067 | $57,500 | $2,200 | $55,300 |
| 2015 | $1,067 | $57,500 | $2,200 | $55,300 |
| 2014 | $1,067 | $57,500 | $2,200 | $55,300 |
Source: Public Records
Map
Nearby Homes