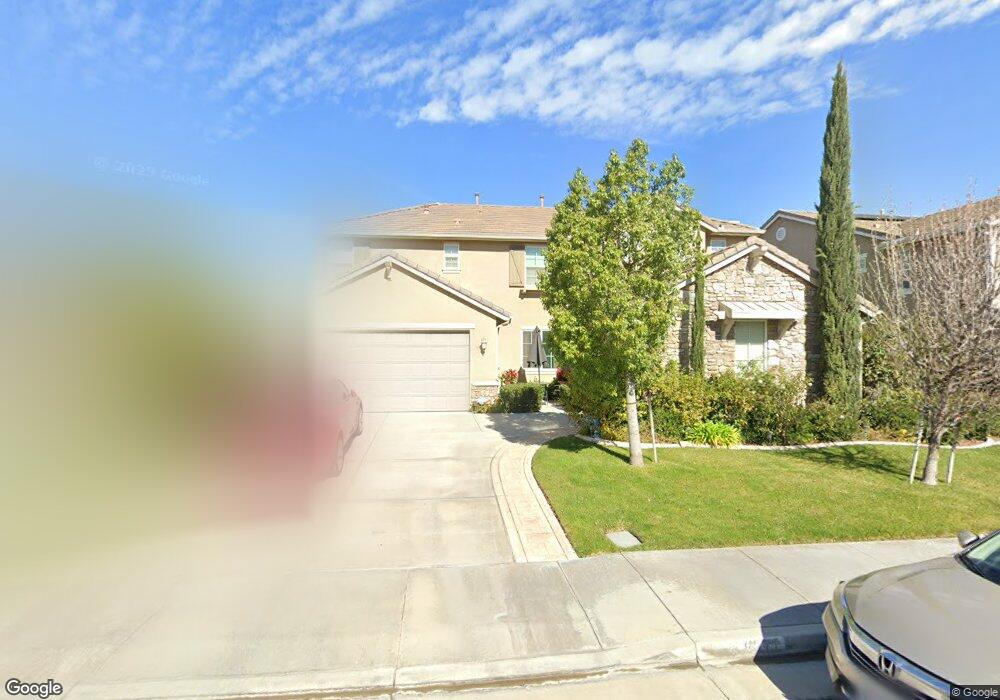
8377 Dew Drop Ct Corona, CA 92880
Estimated Value: $951,553 - $1,107,000
5
Beds
3
Baths
3,188
Sq Ft
$323/Sq Ft
Est. Value
About This Home
This home is located at 8377 Dew Drop Ct, Corona, CA 92880 and is currently estimated at $1,031,138, approximately $323 per square foot. 8377 Dew Drop Ct is a home located in Riverside County with nearby schools including Ronald Reagan Elementary, Dr. Augustine Ramirez Intermediate School, and Eleanor Roosevelt High School.
Ownership History
Date
Name
Owned For
Owner Type
Purchase Details
Closed on
Jun 10, 2021
Sold by
Arango Osvaldo and Arango Lisa
Bought by
Arango Osvaldo and Arango Lisa Debra
Current Estimated Value
Home Financials for this Owner
Home Financials are based on the most recent Mortgage that was taken out on this home.
Original Mortgage
$577,500
Outstanding Balance
$522,854
Interest Rate
2.9%
Mortgage Type
New Conventional
Estimated Equity
$508,284
Purchase Details
Closed on
Sep 1, 2017
Sold by
Arango Osvaldo and Arango Lisa Debra
Bought by
Arango Osvaldo and Arango Lisa Debra
Purchase Details
Closed on
May 28, 2010
Sold by
Standard Pacific Corp
Bought by
Arango Osvaldo and Arango Lisa
Home Financials for this Owner
Home Financials are based on the most recent Mortgage that was taken out on this home.
Original Mortgage
$436,100
Interest Rate
5.5%
Mortgage Type
FHA
Create a Home Valuation Report for This Property
The Home Valuation Report is an in-depth analysis detailing your home's value as well as a comparison with similar homes in the area
Home Values in the Area
Average Home Value in this Area
Purchase History
| Date | Buyer | Sale Price | Title Company |
|---|---|---|---|
| Arango Osvaldo | -- | Western Resources Title | |
| Arango Osvaldo | -- | Western Resources Title | |
| Arango Osvaldo | -- | None Available | |
| Arango Osvaldo | -- | None Available | |
| Arango Osvaldo | $444,500 | First American Title Ins Co |
Source: Public Records
Mortgage History
| Date | Status | Borrower | Loan Amount |
|---|---|---|---|
| Open | Arango Osvaldo | $577,500 | |
| Closed | Arango Osvaldo | $436,100 |
Source: Public Records
Tax History
| Year | Tax Paid | Tax Assessment Tax Assessment Total Assessment is a certain percentage of the fair market value that is determined by local assessors to be the total taxable value of land and additions on the property. | Land | Improvement |
|---|---|---|---|---|
| 2025 | $9,497 | $573,750 | $141,978 | $431,772 |
| 2023 | $9,497 | $551,472 | $136,466 | $415,006 |
| 2022 | $9,236 | $540,660 | $133,791 | $406,869 |
| 2021 | $9,101 | $530,060 | $131,168 | $398,892 |
| 2020 | $8,991 | $524,626 | $129,824 | $394,802 |
| 2019 | $8,822 | $514,340 | $127,279 | $387,061 |
| 2018 | $8,673 | $504,256 | $124,784 | $379,472 |
| 2017 | $8,486 | $494,370 | $122,338 | $372,032 |
| 2016 | $8,380 | $484,678 | $119,940 | $364,738 |
| 2015 | $8,240 | $477,400 | $118,140 | $359,260 |
| 2014 | $8,130 | $468,051 | $115,827 | $352,224 |
Source: Public Records
Map
Nearby Homes
- 14215 Rolling Stream Place
- 8574 Lourenco Ln
- 14297 Goose St
- 14175 Autumn Creek Ct
- 8072 River Bluffs Ln
- 14555 Persimmon Ct
- 14500 Alder Dr
- 14305 Chandler St
- 14915 Shoreham St
- 14403 Redwood Valley Rd
- 7691 Coffeeberry Dr
- 5921 Gramercy Way
- 12720 Rosemount Rd
- 4901 Green Unit 288
- 5932 Rockport Rd
- 5917 Gramercy Way
- 5957 Catskills Ct
- 12706 Rosemount Rd
- 12716 Rosemount Rd
- 4901 Green Unit 303
- 8369 Dew Drop Ct
- 8385 Dew Drop Ct
- 14248 Cherry Creek Cir
- 14242 Cherry Creek Cir
- 14254 Cherry Creek Cir
- 8361 Dew Drop Ct
- 8382 Dew Drop Ct
- 8393 Dew Drop Ct
- 14236 Cherry Creek Cir
- 8374 Dew Drop Ct
- 14258 Cherry Creek Cir
- 14260 Cherry Creek Cir
- 8398 Dew Drop Ct
- 8353 Dew Drop Ct
- 8366 Dew Drop Ct
- 14337 Fern Creek Ct
- 14350 Wisman Dr
- 8358 Dew Drop Ct
- 14230 Cherry Creek Cir
- 14349 Fern Creek Ct
Your Personal Tour Guide
Ask me questions while you tour the home.