8379 Orchard Knoll Ln Unit 8379 Columbus, OH 43235
Olentangy High Bluffs NeighborhoodEstimated Value: $253,415 - $280,000
2
Beds
2
Baths
1,052
Sq Ft
$256/Sq Ft
Est. Value
About This Home
This home is located at 8379 Orchard Knoll Ln Unit 8379, Columbus, OH 43235 and is currently estimated at $268,854, approximately $255 per square foot. 8379 Orchard Knoll Ln Unit 8379 is a home located in Franklin County with nearby schools including Worthington Hills Elementary School, McCord Middle School, and Worthington Kilbourne High School.
Ownership History
Date
Name
Owned For
Owner Type
Purchase Details
Closed on
Jul 9, 2024
Sold by
Michael Ruth E
Bought by
Chrisman Crystal S
Current Estimated Value
Purchase Details
Closed on
Apr 28, 2011
Sold by
Hamann Pamela S and Hamann David A
Bought by
Michael Ruth E
Purchase Details
Closed on
Feb 25, 2011
Sold by
Estate Of Sue F Scott
Bought by
Hamann Pamela S
Purchase Details
Closed on
May 23, 2008
Sold by
Estate Of Dean E Scott
Bought by
Scott Sue E
Purchase Details
Closed on
Oct 3, 2007
Sold by
Homsher Martha B and Estate Of Alice Claire Hoos
Bought by
Scott Dean E and Scott Sue E
Home Financials for this Owner
Home Financials are based on the most recent Mortgage that was taken out on this home.
Original Mortgage
$85,000
Interest Rate
6.5%
Mortgage Type
Purchase Money Mortgage
Purchase Details
Closed on
May 27, 1997
Sold by
Mid Ohio Development Corp
Bought by
Hoos Claire
Create a Home Valuation Report for This Property
The Home Valuation Report is an in-depth analysis detailing your home's value as well as a comparison with similar homes in the area
Home Values in the Area
Average Home Value in this Area
Purchase History
| Date | Buyer | Sale Price | Title Company |
|---|---|---|---|
| Chrisman Crystal S | -- | Search2close | |
| Michael Ruth E | $118,500 | Independent | |
| Hamann Pamela S | -- | None Available | |
| Scott Sue E | -- | None Available | |
| Scott Dean E | $135,000 | Attorney | |
| Hoos Claire | $114,900 | Transohio Title |
Source: Public Records
Mortgage History
| Date | Status | Borrower | Loan Amount |
|---|---|---|---|
| Previous Owner | Scott Dean E | $85,000 |
Source: Public Records
Tax History Compared to Growth
Tax History
| Year | Tax Paid | Tax Assessment Tax Assessment Total Assessment is a certain percentage of the fair market value that is determined by local assessors to be the total taxable value of land and additions on the property. | Land | Improvement |
|---|---|---|---|---|
| 2024 | $3,303 | $63,600 | $6,480 | $57,120 |
| 2023 | $3,196 | $63,595 | $6,475 | $57,120 |
| 2022 | $2,636 | $44,380 | $7,140 | $37,240 |
| 2021 | $2,432 | $44,380 | $7,140 | $37,240 |
| 2020 | $2,343 | $44,380 | $7,140 | $37,240 |
| 2019 | $2,301 | $40,330 | $6,480 | $33,850 |
| 2018 | $1,115 | $40,330 | $6,480 | $33,850 |
| 2017 | $2,062 | $40,330 | $6,480 | $33,850 |
| 2016 | $2,229 | $40,150 | $6,020 | $34,130 |
| 2015 | $1,115 | $40,150 | $6,020 | $34,130 |
| 2014 | $2,229 | $40,150 | $6,020 | $34,130 |
| 2013 | $1,109 | $40,145 | $6,020 | $34,125 |
Source: Public Records
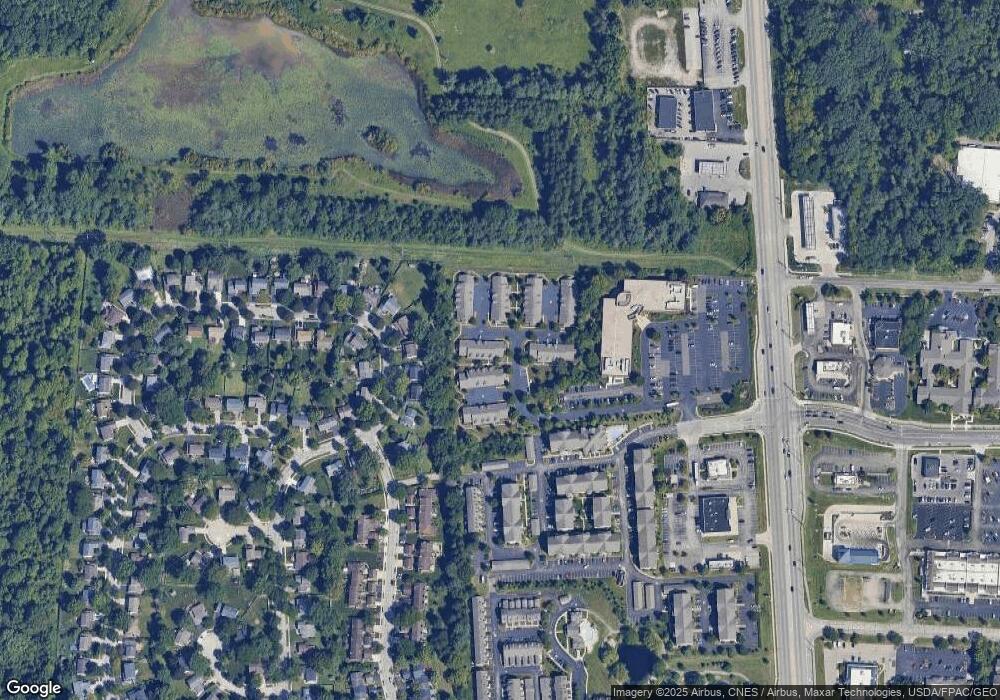
Map
Nearby Homes
- 8326 Bruntsfield Rd
- 128 Green Springs Dr
- 90 Northwoods Blvd Unit B
- 67 Highland Pointe Cir Unit 67
- 8749 Olenmead Dr
- 294 Lazelle Place Ln Unit Q294
- 45 Gold Meadow Dr
- 8747 Olenbrook Dr
- 8824 Rock Dove Rd
- 8750 Woodwind Dr
- 365 Cover Place
- 164 Cameron Ridge Dr Unit 164
- Fiona B Plan at Loch Lomond - Loch Lomond Hills
- 1474 Dogwood Loop
- Fiona A Plan at Loch Lomond - Loch Lomond Hills
- Fiona D Plan at Loch Lomond - Loch Lomond Hills
- Fiona C Plan at Loch Lomond - Loch Lomond Hills
- 1483 Dogwood Loop
- 0 Pocono Rd Unit 225030021
- 687 Sanville Dr
- 8381 Orchard Knoll Ln Unit 8381
- 8383 Orchard Knoll Ln Unit 8383
- 8414 Orchard Knoll Ln
- 8375 Orchard Knoll Ln
- 8373 Orchard Knoll Ln Unit 8373
- 8371 Orchard Knoll Ln Unit 8371
- 8416 Orchard Knoll Ln Unit 8416
- 8500 Nuthatch Way
- 8385 Orchard Knoll Ln Unit 8385
- 8410 Orchard Knoll Ln
- 8492 Nuthatch Way
- 8369 Orchard Knoll Ln Unit 8369
- 8506 Nuthatch Way
- 8418 Orchard Knoll Ln
- 8408 Orchard Knoll Ln
- 8486 Nuthatch Way
- 8406 Orchard Knoll Ln
- 8420 Orchard Knoll Ln
- 8355 Orchard Knoll Ln Unit 8355
- 8357 Orchard Knoll Ln Unit I8357