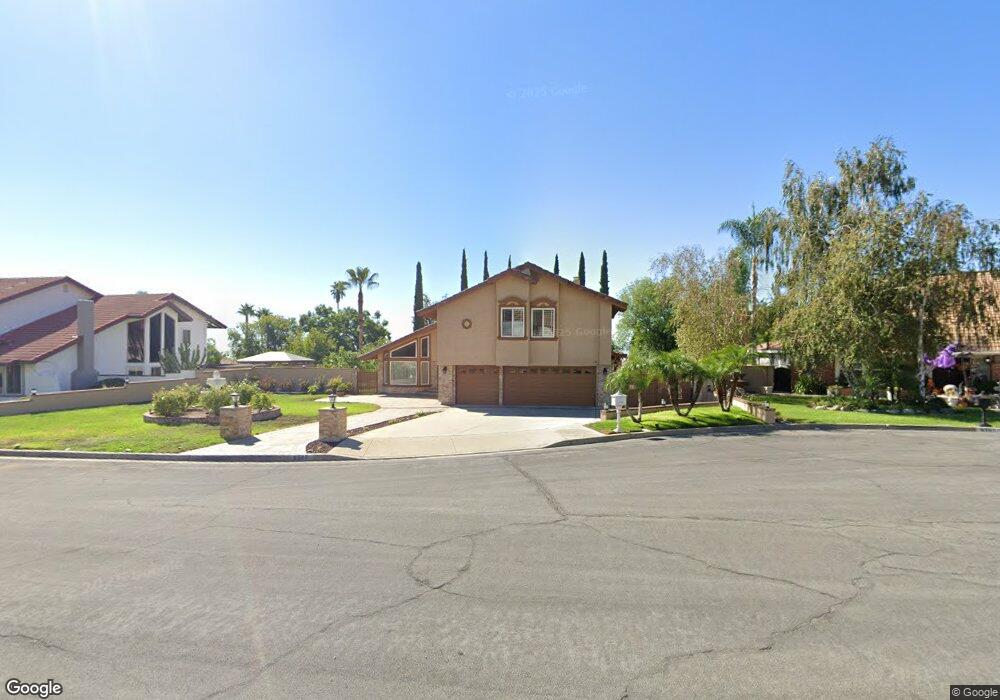
8387 Wilson Ct Rancho Cucamonga, CA 91701
Estimated Value: $1,085,805 - $1,157,000
3
Beds
2
Baths
2,400
Sq Ft
$464/Sq Ft
Est. Value
About This Home
This home is located at 8387 Wilson Ct, Rancho Cucamonga, CA 91701 and is currently estimated at $1,114,201, approximately $464 per square foot. 8387 Wilson Ct is a home located in San Bernardino County with nearby schools including Floyd M. Stork Elementary, Alta Loma Junior High, and Alta Loma High.
Ownership History
Date
Name
Owned For
Owner Type
Purchase Details
Closed on
Apr 12, 2021
Sold by
Nehme Pierre and Nehme Rania
Bought by
Nehme Pierre and Nehme Rania
Current Estimated Value
Home Financials for this Owner
Home Financials are based on the most recent Mortgage that was taken out on this home.
Original Mortgage
$227,000
Outstanding Balance
$170,561
Interest Rate
3.05%
Mortgage Type
New Conventional
Estimated Equity
$943,640
Purchase Details
Closed on
Jan 4, 2006
Sold by
Nehme Pierre
Bought by
Nehme Pierre and Khoury Rania El
Purchase Details
Closed on
Sep 26, 2002
Sold by
Min Byung J and Min Kyu R
Bought by
Nehme Pierre
Home Financials for this Owner
Home Financials are based on the most recent Mortgage that was taken out on this home.
Original Mortgage
$290,000
Interest Rate
6.05%
Create a Home Valuation Report for This Property
The Home Valuation Report is an in-depth analysis detailing your home's value as well as a comparison with similar homes in the area
Home Values in the Area
Average Home Value in this Area
Purchase History
| Date | Buyer | Sale Price | Title Company |
|---|---|---|---|
| Nehme Pierre | -- | Accommodation | |
| Nehme Pierre | -- | Accommodation | |
| Nehme Pierre | $363,000 | First American |
Source: Public Records
Mortgage History
| Date | Status | Borrower | Loan Amount |
|---|---|---|---|
| Open | Nehme Pierre | $227,000 | |
| Closed | Nehme Pierre | $290,000 |
Source: Public Records
Tax History Compared to Growth
Tax History
| Year | Tax Paid | Tax Assessment Tax Assessment Total Assessment is a certain percentage of the fair market value that is determined by local assessors to be the total taxable value of land and additions on the property. | Land | Improvement |
|---|---|---|---|---|
| 2025 | $5,692 | $525,744 | $184,010 | $341,734 |
| 2024 | $5,692 | $515,435 | $180,402 | $335,033 |
| 2023 | $5,564 | $505,329 | $176,865 | $328,464 |
| 2022 | $5,550 | $495,421 | $173,397 | $322,024 |
| 2021 | $5,469 | $485,707 | $169,997 | $315,710 |
| 2020 | $5,243 | $480,727 | $168,254 | $312,473 |
| 2019 | $5,301 | $471,301 | $164,955 | $306,346 |
| 2018 | $5,181 | $462,060 | $161,721 | $300,339 |
| 2017 | $4,943 | $453,000 | $158,550 | $294,450 |
| 2016 | $4,807 | $444,117 | $155,441 | $288,676 |
| 2015 | $4,776 | $437,446 | $153,106 | $284,340 |
| 2014 | $4,639 | $428,877 | $150,107 | $278,770 |
Source: Public Records
Map
Nearby Homes
- 8291 Jennet St
- 5800 Ridgeway Rd
- 6073 Cameo St
- 6087 Aquamarine Ave
- 6114 Sard St
- 6113 Sard St
- 8309 Hillside Rd
- 5830 Emerald St
- 8288 Hillside Rd
- 6165 Hollyoak Dr
- 8010 Rosebud St
- 8093 Banyan St
- 7950 Gardenia Ave
- 6254 Hollyoak Dr
- 8911 Mustang Rd
- 5327 Topaz St
- 8327 La Senda Rd
- 8326 La Senda Rd
- 6108 Vineyard Ave
- 6450 Sard St
- 8409 Wilson Ct
- 8381 Wilson Ct
- 8388 Thoroughbred St
- 8408 Thoroughbred St
- 8376 Thoroughbred St
- 8425 Wilson Ct
- 8377 Wilson Ct
- 8386 Wilson Ct
- 8410 Wilson Ct
- 8352 Thoroughbred St
- 8380 Wilson Ct
- 8424 Thoroughbred St
- 8376 Wilson Ct
- 8441 Wilson Ct
- 8424 Wilson Ct
- 8334 Thoroughbred St
- 8440 Thoroughbred St
- 8440 Wilson Ct
- 8399 Jennet St
- 8381 Jennet St