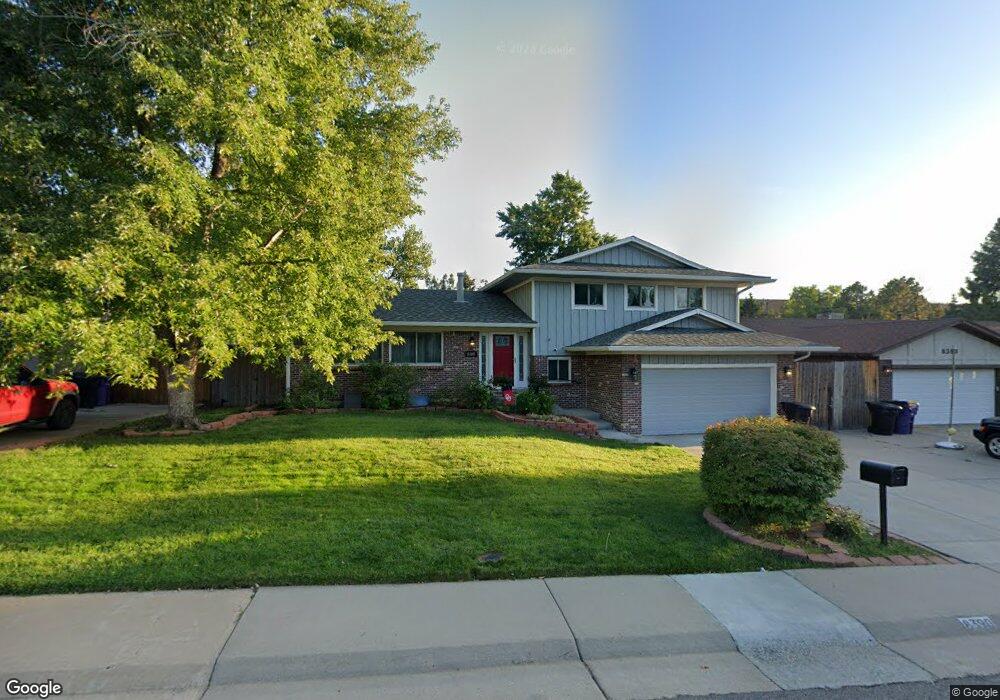
8390 E Princeton Ave Denver, CO 80237
Hampden South NeighborhoodEstimated Value: $584,000 - $632,000
3
Beds
3
Baths
1,453
Sq Ft
$422/Sq Ft
Est. Value
About This Home
This home is located at 8390 E Princeton Ave, Denver, CO 80237 and is currently estimated at $613,249, approximately $422 per square foot. 8390 E Princeton Ave is a home located in Denver County with nearby schools including Samuels Elementary School, Holm Elementary School, and Joe Shoemaker School.
Ownership History
Date
Name
Owned For
Owner Type
Purchase Details
Closed on
Mar 7, 2001
Sold by
Seymour Lisa Ann
Bought by
Plumb Mark D and Steuart Carrie
Current Estimated Value
Home Financials for this Owner
Home Financials are based on the most recent Mortgage that was taken out on this home.
Original Mortgage
$193,600
Interest Rate
7.1%
Purchase Details
Closed on
Oct 26, 1999
Sold by
Selph Dennis N
Bought by
Seymour Erik David and Seymour Lisa Ann
Home Financials for this Owner
Home Financials are based on the most recent Mortgage that was taken out on this home.
Original Mortgage
$145,000
Interest Rate
7.93%
Purchase Details
Closed on
Sep 21, 1995
Sold by
Grace Harry and Grace Terence M
Bought by
Selph Dennis N and Selph Margaret G
Create a Home Valuation Report for This Property
The Home Valuation Report is an in-depth analysis detailing your home's value as well as a comparison with similar homes in the area
Home Values in the Area
Average Home Value in this Area
Purchase History
| Date | Buyer | Sale Price | Title Company |
|---|---|---|---|
| Plumb Mark D | $242,000 | -- | |
| Seymour Erik David | $215,000 | -- | |
| Selph Dennis N | $122,586 | -- |
Source: Public Records
Mortgage History
| Date | Status | Borrower | Loan Amount |
|---|---|---|---|
| Previous Owner | Plumb Mark D | $193,600 | |
| Previous Owner | Seymour Erik David | $145,000 |
Source: Public Records
Tax History
| Year | Tax Paid | Tax Assessment Tax Assessment Total Assessment is a certain percentage of the fair market value that is determined by local assessors to be the total taxable value of land and additions on the property. | Land | Improvement |
|---|---|---|---|---|
| 2025 | $2,483 | $36,470 | $9,930 | $9,930 |
| 2024 | $2,483 | $38,050 | $5,760 | $32,290 |
| 2023 | $2,948 | $38,050 | $5,760 | $32,290 |
| 2022 | $2,587 | $32,530 | $9,790 | $22,740 |
| 2021 | $2,497 | $33,460 | $10,070 | $23,390 |
| 2020 | $2,213 | $29,830 | $10,070 | $19,760 |
| 2019 | $2,151 | $29,830 | $10,070 | $19,760 |
| 2018 | $1,974 | $25,520 | $10,150 | $15,370 |
| 2017 | $1,968 | $25,520 | $10,150 | $15,370 |
| 2016 | $2,075 | $25,440 | $9,894 | $15,546 |
| 2015 | $1,988 | $25,440 | $9,894 | $15,546 |
| 2014 | $1,750 | $21,070 | $7,164 | $13,906 |
Source: Public Records
Map
Nearby Homes
- 8005 E Princeton Ave
- 8364 E Radcliff Ave Unit 398
- 4530 S Verbena St Unit 309
- 4530 S Verbena St Unit 322
- 8344 E Radcliff Ave Unit 395
- 4301 S Alton Place
- 4505 S Yosemite St Unit 371
- 4505 S Yosemite St Unit 125
- 4505 S Yosemite St Unit 142
- 4675 S Yosemite St Unit 205
- 4675 S Yosemite St Unit 215
- 4605 S Yosemite St Unit C-301
- 9055 E Nassau Ave Unit 373
- 9049 E Nassau Ave Unit 376
- 8505 E Temple Dr Unit 513
- 8505 E Temple Dr Unit 501
- 8505 E Temple Dr Unit 473
- 9089 E Nassau Ave Unit 356
- 9194 E Nassau Ave
- 8407 E Lehigh Dr
- 8380 E Princeton Ave
- 8396 E Princeton Ave
- 8400 E Princeton Ave
- 8395 E Princeton Ave
- 8385 E Princeton Ave
- 8360 E Princeton Ave
- 8405 E Princeton Ave
- 8410 E Princeton Ave
- 8375 E Princeton Ave
- 8365 E Princeton Ave
- 8356 E Princeton Ave
- 4181 S Verbena St
- 4182 S Verbena St
- 8420 E Princeton Ave
- 4171 S Verbena St
- 8425 E Princeton Ave
- 4172 S Verbena St
- 8350 E Princeton Ave
- 4190 S Vincennes Ct
- 8430 E Princeton Ave
Your Personal Tour Guide
Ask me questions while you tour the home.