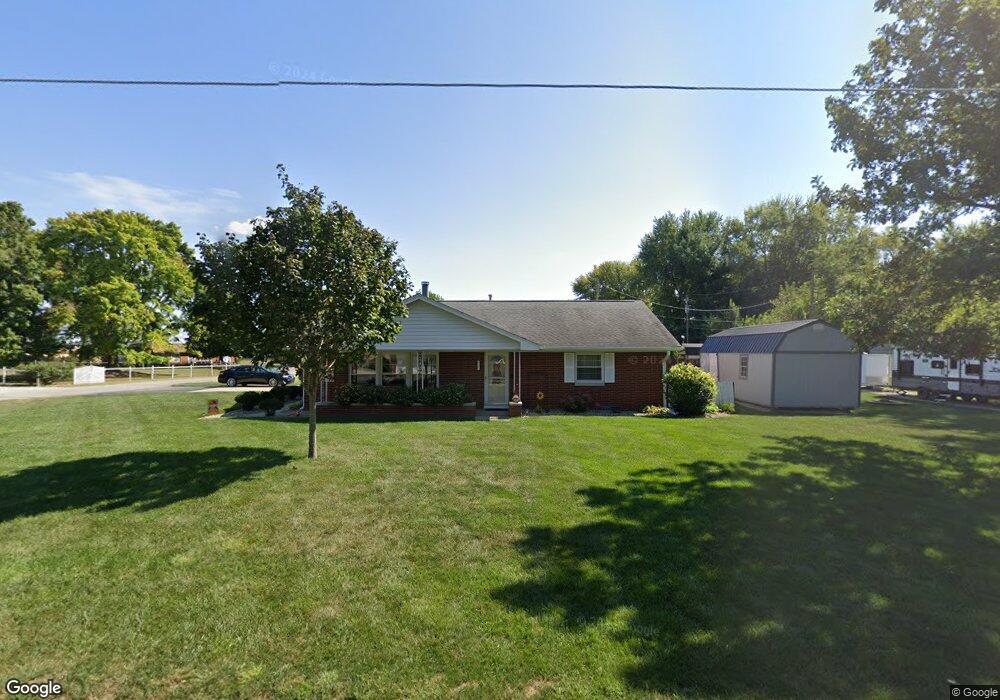
8391 N 325 E Columbus, IN 47203
Estimated Value: $216,378 - $248,000
2
Beds
2
Baths
1,380
Sq Ft
$169/Sq Ft
Est. Value
About This Home
This home is located at 8391 N 325 E, Columbus, IN 47203 and is currently estimated at $233,595, approximately $169 per square foot. 8391 N 325 E is a home located in Bartholomew County with nearby schools including Hope Elementary School and Hauser Junior/Senior High School.
Ownership History
Date
Name
Owned For
Owner Type
Purchase Details
Closed on
Aug 30, 2016
Sold by
Singer William R and Singer Clarissa L
Bought by
Bruer John C and Bruer Christina L
Current Estimated Value
Purchase Details
Closed on
Nov 24, 2015
Sold by
Singer Clarissa L and Singer William R
Bought by
Bruer Christina L and Bruer John C
Purchase Details
Closed on
May 1, 2015
Sold by
Groves Kyle J
Bought by
William and Clarissa
Purchase Details
Closed on
Jul 28, 2011
Sold by
Wilcoxon Pamella S
Bought by
Groves Kyle J
Purchase Details
Closed on
Mar 30, 2007
Sold by
Allman Regina L
Bought by
Wilcoxon Pamella S
Purchase Details
Closed on
Mar 27, 2007
Sold by
Allman Aaron and Allman Venissa
Bought by
Allman Regina L
Purchase Details
Closed on
May 3, 2001
Sold by
Russell Allman and Russell Regina L
Bought by
Allman Regina L
Purchase Details
Closed on
Dec 7, 1999
Sold by
Alvis Jean L
Bought by
Allman Russell and Allman Regina L
Create a Home Valuation Report for This Property
The Home Valuation Report is an in-depth analysis detailing your home's value as well as a comparison with similar homes in the area
Purchase History
| Date | Buyer | Sale Price | Title Company |
|---|---|---|---|
| Bruer John C | -- | Attorney | |
| Bruer Christina L | -- | Attorney | |
| William | $113,000 | National Link | |
| Groves Kyle J | $115,000 | Lawyers Title | |
| Groves Kyle J | $115,000 | -- | |
| Wilcoxon Pamella S | -- | Attorney | |
| Allman Regina L | -- | None Available | |
| Allman Regina L | -- | -- | |
| Allman Russell | $88,000 | -- |
Source: Public Records
Tax History
| Year | Tax Paid | Tax Assessment Tax Assessment Total Assessment is a certain percentage of the fair market value that is determined by local assessors to be the total taxable value of land and additions on the property. | Land | Improvement |
|---|---|---|---|---|
| 2025 | $978 | $152,300 | $30,300 | $122,000 |
| 2024 | $963 | $148,200 | $30,300 | $117,900 |
| 2023 | $963 | $148,300 | $30,300 | $118,000 |
| 2022 | $1,028 | $145,000 | $30,300 | $114,700 |
| 2021 | $1,041 | $133,900 | $26,100 | $107,800 |
| 2020 | $798 | $110,200 | $26,100 | $84,100 |
| 2019 | $720 | $106,600 | $26,100 | $80,500 |
| 2018 | $693 | $106,600 | $26,100 | $80,500 |
| 2017 | $660 | $105,600 | $26,100 | $79,500 |
| 2016 | $722 | $108,300 | $27,100 | $81,200 |
| 2014 | $793 | $109,000 | $27,100 | $81,900 |
| 2013 | $793 | $109,000 | $27,100 | $81,900 |
Source: Public Records
Map
Nearby Homes
- 6452 E 550 N
- 4934 E Sugar St
- 7120 N 250 E
- 13053 N River Grove Dr
- 5133 Delray Dr
- 5115 Sanibel Dr
- 4712 Clairmont Dr
- 5176 Marco Dr
- 4651 Monterey Dr
- 4697 W Ridge Dr
- 5737 Lauren Ln
- Lot 45 Taylor Dr
- 3751 Sycamore Bend Way N
- 3792 Taylor Ct
- 5202 E Harvard Ct
- 3363 Cessna Dr
- 4651 Maplelawn Dr
- 3638 Sycamore Bend Way N
- 3676 Sycamore Bend Way S
- 3736 Sycamore Bend Way S
Your Personal Tour Guide
Ask me questions while you tour the home.