Estimated Value: $527,000 - $581,062
3
Beds
2
Baths
2,344
Sq Ft
$238/Sq Ft
Est. Value
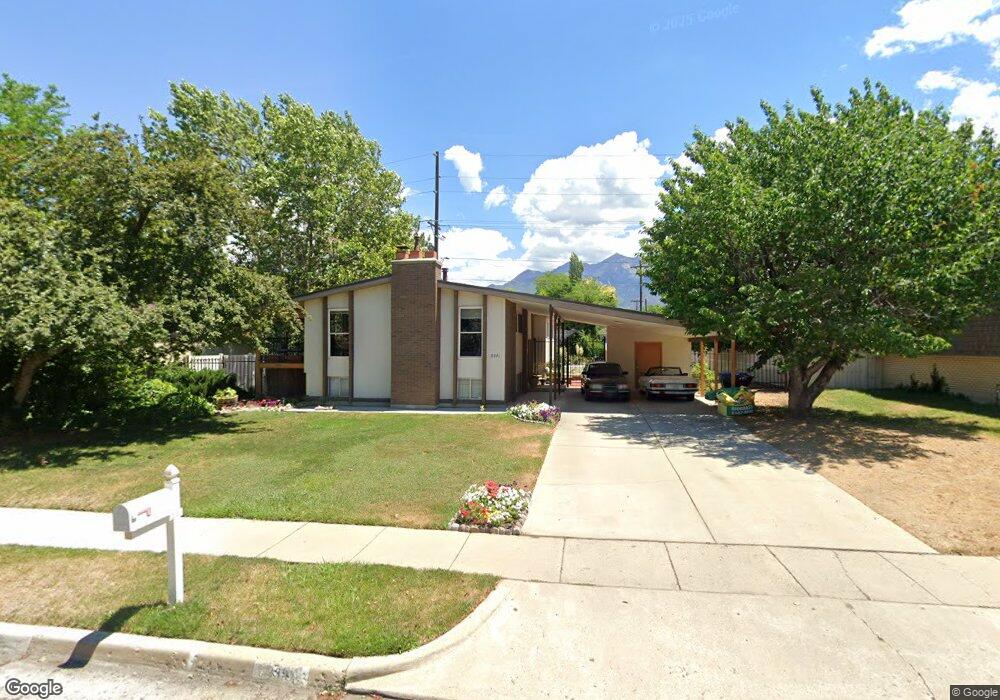
About This Home
This home is located at 8391 S 1275 E, Sandy, UT 84094 and is currently estimated at $557,016, approximately $237 per square foot. 8391 S 1275 E is a home located in Salt Lake County with nearby schools including Peruvian Park Elementary School, Hillcrest High School, and Union Middle School.
Ownership History
Date
Name
Owned For
Owner Type
Purchase Details
Closed on
Jan 29, 2021
Sold by
Collinson Georgina H and Collinson Family Trust
Bought by
Azar Simon Sami and Khoury Reham
Current Estimated Value
Home Financials for this Owner
Home Financials are based on the most recent Mortgage that was taken out on this home.
Original Mortgage
$369,352
Outstanding Balance
$330,173
Interest Rate
2.67%
Mortgage Type
FHA
Estimated Equity
$226,843
Purchase Details
Closed on
Jun 17, 1996
Sold by
Collinson Wallace E and Collinson Georgina H
Bought by
Collinson Wallace E and Collinson Georgina H
Home Financials for this Owner
Home Financials are based on the most recent Mortgage that was taken out on this home.
Original Mortgage
$10,000
Interest Rate
8.03%
Purchase Details
Closed on
Mar 13, 1995
Sold by
Collinson Wallace E and Collinson Georgina H
Bought by
Collinson Wallace E and Collinson Georgina H
Create a Home Valuation Report for This Property
The Home Valuation Report is an in-depth analysis detailing your home's value as well as a comparison with similar homes in the area
Home Values in the Area
Average Home Value in this Area
Purchase History
| Date | Buyer | Sale Price | Title Company |
|---|---|---|---|
| Azar Simon Sami | -- | Old Republic Ttl Draper Orem | |
| Collinson Wallace E | -- | -- | |
| Collinson Wallace E | -- | First American Title | |
| Collinson Wallace E | -- | -- |
Source: Public Records
Mortgage History
| Date | Status | Borrower | Loan Amount |
|---|---|---|---|
| Open | Azar Simon Sami | $369,352 | |
| Previous Owner | Collinson Wallace E | $10,000 |
Source: Public Records
Tax History
| Year | Tax Paid | Tax Assessment Tax Assessment Total Assessment is a certain percentage of the fair market value that is determined by local assessors to be the total taxable value of land and additions on the property. | Land | Improvement |
|---|---|---|---|---|
| 2025 | $3,903 | $513,100 | $153,700 | $359,400 |
| 2024 | $3,903 | $515,700 | $147,800 | $367,900 |
| 2023 | $3,477 | $507,800 | $140,500 | $367,300 |
| 2022 | $3,788 | $510,100 | $137,700 | $372,400 |
| 2021 | $2,674 | $329,800 | $107,000 | $222,800 |
| 2020 | $2,477 | $301,200 | $107,000 | $194,200 |
| 2019 | $2,326 | $281,100 | $95,400 | $185,700 |
| 2016 | $2,017 | $238,500 | $95,400 | $143,100 |
Source: Public Records
Map
Nearby Homes
- 8352 S 1330 E
- 8373 S 1100 E Unit 39
- 8411 S 1475 E
- 8569 Round Stone Cove
- 8569 Round Stone Cove Unit 8
- 8485 S Harvard Park Dr
- 1371 Sudbury Ave
- 8583 S Harvard Park Dr
- 1430 E 8685 S
- 991 Merewood Ct
- 8492 S Mesa Dr
- 1627 E Mulberry Way
- 8797 S Capella Way
- 1579 E 8730 S
- 8857 S Capella Way
- 8268 S 865 E
- 8638 Piper Ln
- 8935 Quarry Stone Way
- 8642 S Cessna Cir
- 8081 Beaumont Dr
Your Personal Tour Guide
Ask me questions while you tour the home.