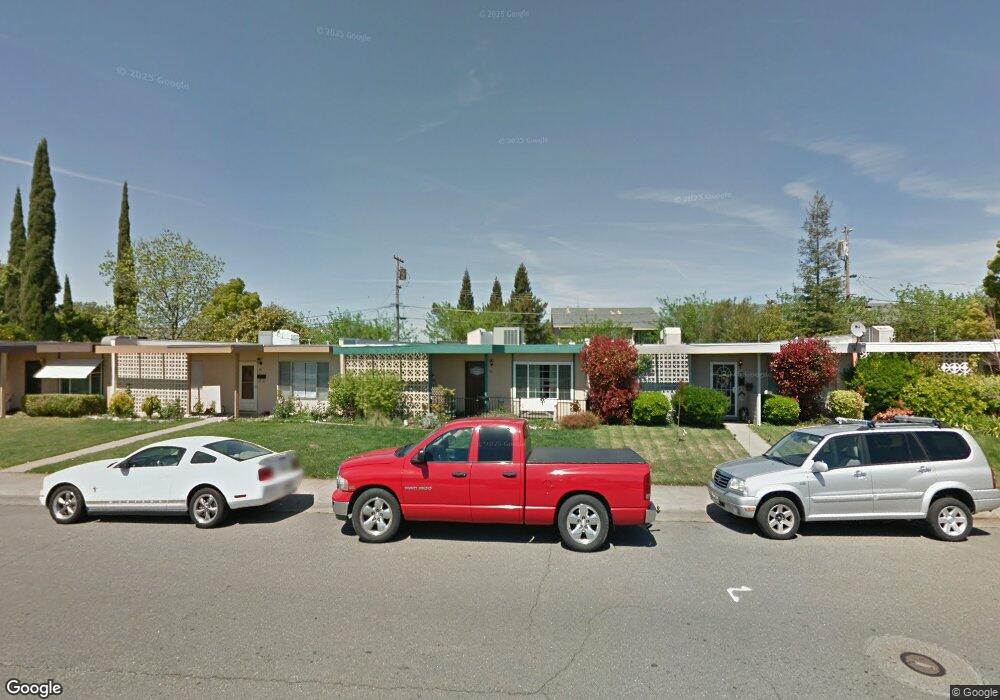
84 Dean Way Folsom, CA 95630
Estimated Value: $263,000 - $432,000
2
Beds
1
Bath
880
Sq Ft
$420/Sq Ft
Est. Value
About This Home
This home is located at 84 Dean Way, Folsom, CA 95630 and is currently estimated at $370,000, approximately $420 per square foot. 84 Dean Way is a home located in Sacramento County with nearby schools including Theodore Judah Elementary School, Sutter Middle School, and Folsom High School.
Ownership History
Date
Name
Owned For
Owner Type
Purchase Details
Closed on
Mar 24, 2006
Sold by
Muir Stephanie D
Bought by
Muir Timothy and Muir Stephanie D
Current Estimated Value
Home Financials for this Owner
Home Financials are based on the most recent Mortgage that was taken out on this home.
Original Mortgage
$122,200
Outstanding Balance
$69,388
Interest Rate
6.25%
Mortgage Type
New Conventional
Estimated Equity
$300,612
Purchase Details
Closed on
Apr 20, 2001
Sold by
Parker Piatt Beth G and Piatt Ronald G
Bought by
Sanchez Stephanie D
Home Financials for this Owner
Home Financials are based on the most recent Mortgage that was taken out on this home.
Original Mortgage
$101,097
Interest Rate
6.98%
Mortgage Type
FHA
Create a Home Valuation Report for This Property
The Home Valuation Report is an in-depth analysis detailing your home's value as well as a comparison with similar homes in the area
Home Values in the Area
Average Home Value in this Area
Purchase History
| Date | Buyer | Sale Price | Title Company |
|---|---|---|---|
| Muir Timothy | -- | Old Republic Title Company | |
| Muir Stephanie D | -- | Old Republic Title Company | |
| Sanchez Stephanie D | $102,000 | Old Republic Title Company |
Source: Public Records
Mortgage History
| Date | Status | Borrower | Loan Amount |
|---|---|---|---|
| Open | Muir Stephanie D | $122,200 | |
| Closed | Muir Stephanie D | $38,000 | |
| Closed | Sanchez Stephanie D | $101,097 |
Source: Public Records
Tax History Compared to Growth
Tax History
| Year | Tax Paid | Tax Assessment Tax Assessment Total Assessment is a certain percentage of the fair market value that is determined by local assessors to be the total taxable value of land and additions on the property. | Land | Improvement |
|---|---|---|---|---|
| 2025 | $1,565 | $153,669 | $37,654 | $116,015 |
| 2024 | $1,565 | $150,657 | $36,916 | $113,741 |
| 2023 | $1,536 | $147,704 | $36,193 | $111,511 |
| 2022 | $1,512 | $144,809 | $35,484 | $109,325 |
| 2021 | $1,491 | $141,971 | $34,789 | $107,182 |
| 2020 | $1,471 | $140,516 | $34,433 | $106,083 |
| 2019 | $1,445 | $137,761 | $33,758 | $104,003 |
| 2018 | $1,408 | $135,061 | $33,097 | $101,964 |
| 2017 | $1,312 | $132,414 | $32,449 | $99,965 |
| 2016 | $1,369 | $129,818 | $31,813 | $98,005 |
| 2015 | $1,322 | $127,869 | $31,336 | $96,533 |
| 2014 | $1,253 | $125,366 | $30,723 | $94,643 |
Source: Public Records
Map
Nearby Homes
- 98-98 1/2 Dean Way
- 167 Price Way
- 214 Rugosa Dr
- 151 Glenn Dr
- 124 Fargo Way
- 901 Coloma St
- 293 Leidesdorff St
- 408 Sutter St
- 103 Grenoble Way
- 603 Figueroa St
- 709- Persifer St
- 260 Flower Dr
- 237 Evelyn Way
- 45 Diggins Dr
- 119 Del Norte Vista Way
- 110 Lembi Dr
- 106 McNamee Dr
- 190 Oxburough Dr
- 121 Chesterfield Way
- 900 Figueroa St Unit B