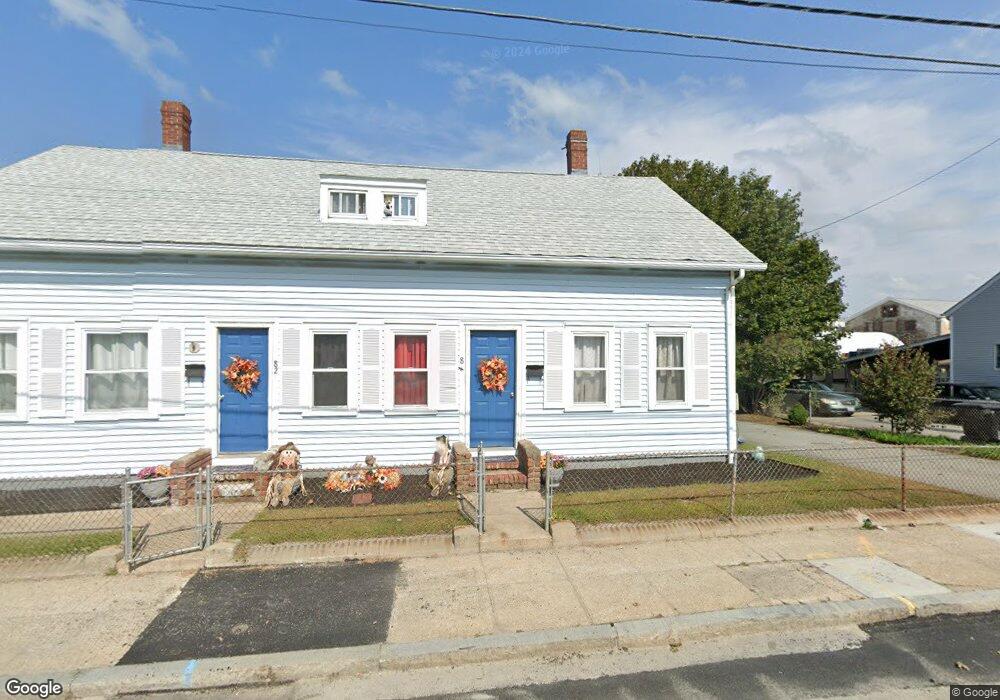
84 E Main St West Warwick, RI 02893
West Warwick Centre NeighborhoodEstimated Value: $411,426 - $565,000
6
Beds
2
Baths
1,914
Sq Ft
$246/Sq Ft
Est. Value
About This Home
This home is located at 84 E Main St, West Warwick, RI 02893 and is currently estimated at $470,357, approximately $245 per square foot. 84 E Main St is a home located in Kent County with nearby schools including West Warwick High School, Islamic School of Rhode Island, and St Joseph School.
Ownership History
Date
Name
Owned For
Owner Type
Purchase Details
Closed on
Aug 3, 2022
Sold by
Atwell Robert J and Atwell Joyce
Bought by
Lowe Andrew C and Lowe Elizabeth A
Current Estimated Value
Home Financials for this Owner
Home Financials are based on the most recent Mortgage that was taken out on this home.
Original Mortgage
$296,530
Outstanding Balance
$282,685
Interest Rate
5.81%
Mortgage Type
FHA
Estimated Equity
$187,672
Purchase Details
Closed on
Apr 21, 2022
Sold by
T F Atwell Jr 2020 Ret
Bought by
Atwell Robert J and Atwell Joyce
Purchase Details
Closed on
Sep 21, 2020
Sold by
Atwell Thomas
Bought by
Thomas Atwell Jr 2020 Ret
Purchase Details
Closed on
May 14, 2002
Sold by
Petrarca Crispino and Petrarca Giovanna
Bought by
Atwell Thomas
Home Financials for this Owner
Home Financials are based on the most recent Mortgage that was taken out on this home.
Original Mortgage
$118,800
Interest Rate
7.18%
Create a Home Valuation Report for This Property
The Home Valuation Report is an in-depth analysis detailing your home's value as well as a comparison with similar homes in the area
Home Values in the Area
Average Home Value in this Area
Purchase History
| Date | Buyer | Sale Price | Title Company |
|---|---|---|---|
| Lowe Andrew C | $302,000 | None Available | |
| Atwell Robert J | -- | None Available | |
| Thomas Atwell Jr 2020 Ret | -- | None Available | |
| Atwell Thomas | $135,000 | -- |
Source: Public Records
Mortgage History
| Date | Status | Borrower | Loan Amount |
|---|---|---|---|
| Open | Lowe Andrew C | $296,530 | |
| Previous Owner | Atwell Thomas | $20,000 | |
| Previous Owner | Atwell Thomas | $123,500 | |
| Previous Owner | Atwell Thomas | $118,800 |
Source: Public Records
Tax History
| Year | Tax Paid | Tax Assessment Tax Assessment Total Assessment is a certain percentage of the fair market value that is determined by local assessors to be the total taxable value of land and additions on the property. | Land | Improvement |
|---|---|---|---|---|
| 2025 | $5,160 | $337,500 | $84,000 | $253,500 |
| 2024 | $4,962 | $242,400 | $53,400 | $189,000 |
| 2023 | $4,865 | $242,400 | $53,400 | $189,000 |
| 2022 | $4,787 | $242,400 | $53,400 | $189,000 |
| 2021 | $5,072 | $169,700 | $43,800 | $125,900 |
| 2020 | $5,072 | $169,700 | $43,800 | $125,900 |
| 2019 | $4,976 | $169,700 | $43,800 | $125,900 |
| 2018 | $4,246 | $113,100 | $41,200 | $71,900 |
| 2017 | $4,209 | $110,900 | $41,200 | $69,700 |
| 2016 | $4,133 | $110,900 | $41,200 | $69,700 |
| 2015 | $2,972 | $114,500 | $41,200 | $73,300 |
| 2014 | -- | $114,500 | $41,200 | $73,300 |
Source: Public Records
Map
Nearby Homes
- 29 Brayton St
- 30 Potter Ave
- 40 Youngs Ave
- 6 Emerson Ct
- 93 Tanglewood Dr
- 21 Colvin St
- 10 Hall St
- 22 Greene St
- 13 Bettez St
- 22 Bettez St
- 5 Cyr Ct
- 328 New London Ave
- 26 Ledge Dr
- 52 Earl St
- 25 Eddy St
- 10 Grove St
- 351 New London Ave Unit 408
- 351 New London Ave Unit 304
- 351 New London Ave Unit 302
- 46 Hoover St
Your Personal Tour Guide
Ask me questions while you tour the home.