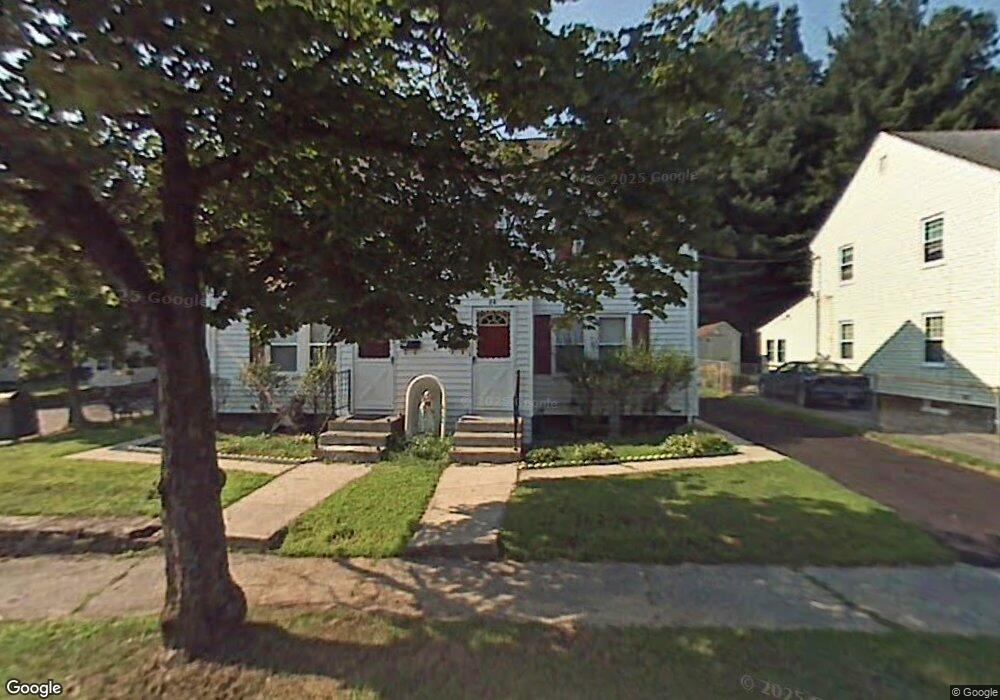
84 Reed St Worcester, MA 01602
Columbus Park NeighborhoodEstimated Value: $467,281 - $579,000
4
Beds
2
Baths
1,728
Sq Ft
$317/Sq Ft
Est. Value
About This Home
This home is located at 84 Reed St, Worcester, MA 01602 and is currently estimated at $547,070, approximately $316 per square foot. 84 Reed St is a home located in Worcester County with nearby schools including Chandler Magnet, Jacob Hiatt Magnet School, and May Street Elementary School.
Ownership History
Date
Name
Owned For
Owner Type
Purchase Details
Closed on
Jul 22, 2013
Sold by
Lebron Zoraida and Martinez Edmundo
Bought by
Loce Andi S and Loce Joselda
Current Estimated Value
Home Financials for this Owner
Home Financials are based on the most recent Mortgage that was taken out on this home.
Original Mortgage
$169,200
Outstanding Balance
$121,835
Interest Rate
3.92%
Mortgage Type
New Conventional
Estimated Equity
$425,235
Purchase Details
Closed on
Oct 29, 1997
Sold by
Mattson John F
Bought by
Kimbar David M
Home Financials for this Owner
Home Financials are based on the most recent Mortgage that was taken out on this home.
Original Mortgage
$106,701
Interest Rate
7.31%
Mortgage Type
Purchase Money Mortgage
Create a Home Valuation Report for This Property
The Home Valuation Report is an in-depth analysis detailing your home's value as well as a comparison with similar homes in the area
Home Values in the Area
Average Home Value in this Area
Purchase History
| Date | Buyer | Sale Price | Title Company |
|---|---|---|---|
| Loce Andi S | $211,500 | -- | |
| Loce Andi S | $211,500 | -- | |
| Kimbar David M | $108,500 | -- |
Source: Public Records
Mortgage History
| Date | Status | Borrower | Loan Amount |
|---|---|---|---|
| Open | Loce Andi S | $169,200 | |
| Closed | Loce Andi S | $169,200 | |
| Previous Owner | Kimbar David M | $106,701 | |
| Previous Owner | Kimbar David M | $105,000 |
Source: Public Records
Tax History
| Year | Tax Paid | Tax Assessment Tax Assessment Total Assessment is a certain percentage of the fair market value that is determined by local assessors to be the total taxable value of land and additions on the property. | Land | Improvement |
|---|---|---|---|---|
| 2025 | $5,717 | $433,400 | $108,400 | $325,000 |
| 2024 | $5,566 | $404,800 | $108,400 | $296,400 |
| 2023 | $5,055 | $352,500 | $94,200 | $258,300 |
| 2022 | $5,076 | $333,700 | $75,400 | $258,300 |
| 2021 | $4,337 | $266,400 | $60,300 | $206,100 |
| 2020 | $3,766 | $221,500 | $60,300 | $161,200 |
| 2019 | $3,748 | $208,200 | $54,200 | $154,000 |
| 2018 | $3,856 | $203,900 | $54,200 | $149,700 |
| 2017 | $3,875 | $201,600 | $54,200 | $147,400 |
| 2016 | $3,753 | $182,100 | $41,000 | $141,100 |
| 2015 | $3,655 | $182,100 | $41,000 | $141,100 |
| 2014 | $3,558 | $182,100 | $41,000 | $141,100 |
Source: Public Records
Map
Nearby Homes
- 86 Reed St
- 84 Reed St Unit 84
- 84 Reed St Unit 86
- 82 Reed St
- 80 Reed St
- 58 Walworth St
- 51 Walworth St
- 49 Walworth St
- 51 Walworth St Unit 51
- 78 Reed St
- 47 Walworth St Unit 2
- 76 Reed St
- 76 Reed St Unit 76
- 49-51 Walworth St
- 36 Walworth St
- 60 Walworth St
- 45 Walworth St
- 53 Walworth St
- 63 Reed St
- 41 Walworth St
Your Personal Tour Guide
Ask me questions while you tour the home.