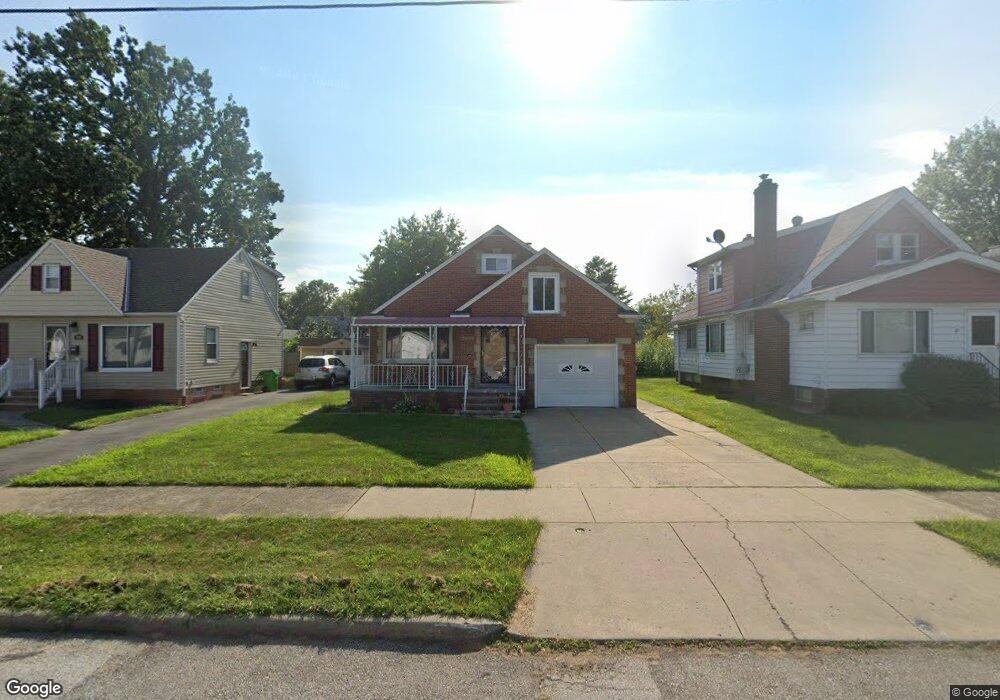
840 E 209th St Cleveland, OH 44119
Estimated Value: $107,000 - $155,000
2
Beds
1
Bath
768
Sq Ft
$160/Sq Ft
Est. Value
About This Home
This home is located at 840 E 209th St, Cleveland, OH 44119 and is currently estimated at $122,620, approximately $159 per square foot. 840 E 209th St is a home located in Cuyahoga County with nearby schools including Arbor Elementary School, Euclid Middle School, and Euclid High School.
Ownership History
Date
Name
Owned For
Owner Type
Purchase Details
Closed on
Feb 22, 2002
Sold by
Parker Samuel and Parker Sheila D
Bought by
Madden Keith A
Current Estimated Value
Home Financials for this Owner
Home Financials are based on the most recent Mortgage that was taken out on this home.
Original Mortgage
$104,500
Outstanding Balance
$40,541
Interest Rate
6.92%
Estimated Equity
$82,079
Purchase Details
Closed on
Jun 5, 1991
Sold by
Matic Miso
Bought by
Parker Samuel
Purchase Details
Closed on
Aug 28, 1990
Sold by
Josip Stajduhar
Bought by
Matic Miso
Purchase Details
Closed on
Jan 6, 1983
Sold by
Stajduhar Josip
Bought by
Josip Stajduhar
Purchase Details
Closed on
Aug 10, 1976
Sold by
Julylia Frances
Bought by
Stajduhar Josip
Purchase Details
Closed on
Jan 1, 1975
Bought by
Julylia Frances
Create a Home Valuation Report for This Property
The Home Valuation Report is an in-depth analysis detailing your home's value as well as a comparison with similar homes in the area
Home Values in the Area
Average Home Value in this Area
Purchase History
| Date | Buyer | Sale Price | Title Company |
|---|---|---|---|
| Madden Keith A | $104,500 | Pro Title Agency Inc | |
| Parker Samuel | $68,000 | -- | |
| Matic Miso | $63,000 | -- | |
| Josip Stajduhar | -- | -- | |
| Stajduhar Josip | $38,500 | -- | |
| Julylia Frances | -- | -- |
Source: Public Records
Mortgage History
| Date | Status | Borrower | Loan Amount |
|---|---|---|---|
| Open | Madden Keith A | $104,500 |
Source: Public Records
Tax History
| Year | Tax Paid | Tax Assessment Tax Assessment Total Assessment is a certain percentage of the fair market value that is determined by local assessors to be the total taxable value of land and additions on the property. | Land | Improvement |
|---|---|---|---|---|
| 2025 | $2,385 | $35,280 | $7,910 | $27,370 |
| 2024 | $2,459 | $35,280 | $7,910 | $27,370 |
| 2023 | $2,109 | $23,940 | $6,230 | $17,710 |
| 2022 | $2,062 | $23,940 | $6,230 | $17,710 |
| 2021 | $2,289 | $23,940 | $6,230 | $17,710 |
| 2020 | $1,928 | $18,130 | $4,730 | $13,410 |
| 2019 | $1,730 | $51,800 | $13,500 | $38,300 |
| 2018 | $1,697 | $18,130 | $4,730 | $13,410 |
| 2017 | $1,784 | $15,470 | $3,150 | $12,320 |
| 2016 | $1,787 | $15,470 | $3,150 | $12,320 |
| 2015 | $1,631 | $15,470 | $3,150 | $12,320 |
| 2014 | $1,631 | $15,470 | $3,150 | $12,320 |
Source: Public Records
Map
Nearby Homes
- 824 E 207th St
- 20430 Miller Ave
- 931 E 214th St
- 20731 Goller Ave
- 19810 Muskoka Ave
- 21250 Milan Dr
- 19901 Pawnee Ave
- 19600 Arrowhead Ave
- 21840 Miller Ave
- 828 E 216th St
- 21130 Arbor Ave
- 560 E 200th St
- 19409 Cherokee Ave
- 19417 Mohawk Ave
- 19830 Monterey Ave
- 19314 Muskoka Ave
- 19771 Monterey Ave
- 19316 Shawnee Ave
- 21100 Nicholas Ave
- 19211 Chickasaw Ave
- 832 E 209th St
- 846 E 209th St
- 830 E 209th St
- 850 E 209th St
- 831 E 207th St
- 841 E 207th St
- 820 E 209th St
- 820 E 209th St Unit E
- 823 E 207th St
- 847 E 207th St
- 20916 Recher Ave
- 856 E 209th St
- 845 E 209th St
- 815 E 207th St
- 851 E 207th St
- 853 E 209th St
- 862 E 209th St
- 813 E 207th St
- 857 E 207th St
- 801 E 207th St
Your Personal Tour Guide
Ask me questions while you tour the home.