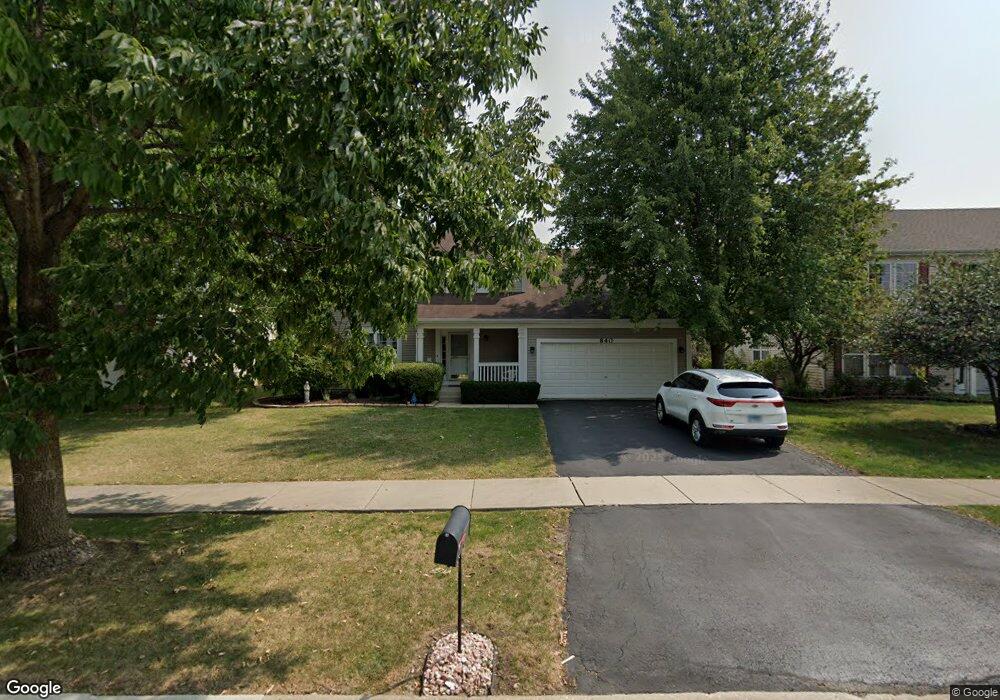
840 Fieldcrest Dr Naperville, IL 60540
West Sanctuary Lane NeighborhoodEstimated Value: $561,000 - $622,000
4
Beds
3
Baths
2,400
Sq Ft
$247/Sq Ft
Est. Value
About This Home
This home is located at 840 Fieldcrest Dr, Naperville, IL 60540 and is currently estimated at $592,693, approximately $246 per square foot. 840 Fieldcrest Dr is a home located in DuPage County with nearby schools including Mary Lou Cowlishaw Elementary School, Still Middle School, and Metea Valley High School.
Ownership History
Date
Name
Owned For
Owner Type
Purchase Details
Closed on
Jul 27, 2023
Sold by
Verna And Ronald Martin Living Trust
Bought by
Schiro Susan M
Current Estimated Value
Purchase Details
Closed on
Aug 12, 2011
Sold by
Martin Verna M
Bought by
Martin Verna M and Martin Ronald L
Purchase Details
Closed on
Oct 6, 2010
Sold by
Martin Verna M and Martin Ronald L
Bought by
Martin Verna M and Verna & Ronald Martin Living Trust
Purchase Details
Closed on
Jan 29, 2007
Sold by
Martin Verna M
Bought by
Martin Verna M and Martin Ronald L
Purchase Details
Closed on
Feb 16, 2005
Sold by
Martin Verna M
Bought by
Martin Verna M and The Verna & Ronald Martin Living Trust
Purchase Details
Closed on
Jul 17, 1997
Sold by
Martin Verna M and Robbins Susan M
Bought by
Martin Verna M and The Verna M Martin Living Trust
Purchase Details
Closed on
May 16, 1997
Sold by
The Northern Trust Company
Bought by
Martin Verna M and Robbins Susan M
Create a Home Valuation Report for This Property
The Home Valuation Report is an in-depth analysis detailing your home's value as well as a comparison with similar homes in the area
Home Values in the Area
Average Home Value in this Area
Purchase History
| Date | Buyer | Sale Price | Title Company |
|---|---|---|---|
| Schiro Susan M | -- | None Listed On Document | |
| Verna And Ronald Martin Living Trust | -- | None Listed On Document | |
| Martin Verna M | -- | None Available | |
| Martin Verna M | -- | None Available | |
| Martin Verna M | -- | None Available | |
| Martin Verna M | -- | -- | |
| Martin Verna M | -- | -- | |
| Martin Verna M | $202,000 | -- |
Source: Public Records
Tax History Compared to Growth
Tax History
| Year | Tax Paid | Tax Assessment Tax Assessment Total Assessment is a certain percentage of the fair market value that is determined by local assessors to be the total taxable value of land and additions on the property. | Land | Improvement |
|---|---|---|---|---|
| 2024 | $10,423 | $166,979 | $46,452 | $120,527 |
| 2023 | $10,032 | $150,040 | $41,740 | $108,300 |
| 2022 | $9,734 | $142,430 | $39,320 | $103,110 |
| 2021 | $9,441 | $137,350 | $37,920 | $99,430 |
| 2020 | $9,428 | $137,350 | $37,920 | $99,430 |
| 2019 | $9,077 | $130,640 | $36,070 | $94,570 |
| 2018 | $8,914 | $125,920 | $34,500 | $91,420 |
| 2017 | $8,682 | $121,650 | $33,330 | $88,320 |
| 2016 | $8,541 | $116,750 | $31,990 | $84,760 |
| 2015 | $8,482 | $110,850 | $30,370 | $80,480 |
| 2014 | $8,108 | $102,290 | $27,820 | $74,470 |
| 2013 | $8,087 | $103,000 | $28,010 | $74,990 |
Source: Public Records
Map
Nearby Homes
- 2459 Emerson Ln
- 891 Lowell Ln
- 822 Shandrew Dr Unit 103
- 2783 Blakely Ln Unit 34
- 2809 Blakely Ln Unit 24
- 1262 Rhodes Ln Unit 2701
- 695 Station Blvd
- 134 S Whispering Hills Dr
- 664 Grosvenor Ln
- 1208 Tennyson Ln
- 1114 Tennyson Ln
- 122 Encina Dr
- 877 Lewisburg Ln
- 563 Grosvenor Ln
- 4199 Milford Ln Unit 904
- 848 Station Blvd Unit 701
- 291 Gregory St Unit 6
- 157 Gregory St Unit 2
- 4177 Irving Rd
- 4138 Irving Rd
- 836 Fieldcrest Dr
- 844 Fieldcrest Dr
- 848 Fieldcrest Dr
- 828 Fieldcrest Dr
- 835 Fieldcrest Dr
- 839 Fieldcrest Dr
- 843 Fieldcrest Dr
- 831 Fieldcrest Dr
- 824 Fieldcrest Dr Unit 3
- 2347 Lexington Ln Unit 1
- 2343 Lexington Ln
- 847 Fieldcrest Dr
- 827 Fieldcrest Dr
- 2339 Lexington Ln
- 820 Fieldcrest Dr
- 851 Fieldcrest Dr
- 2452 Emerson Ln
- 2456 Emerson Ln
- 2460 Emerson Ln
- 2335 Lexington Ln