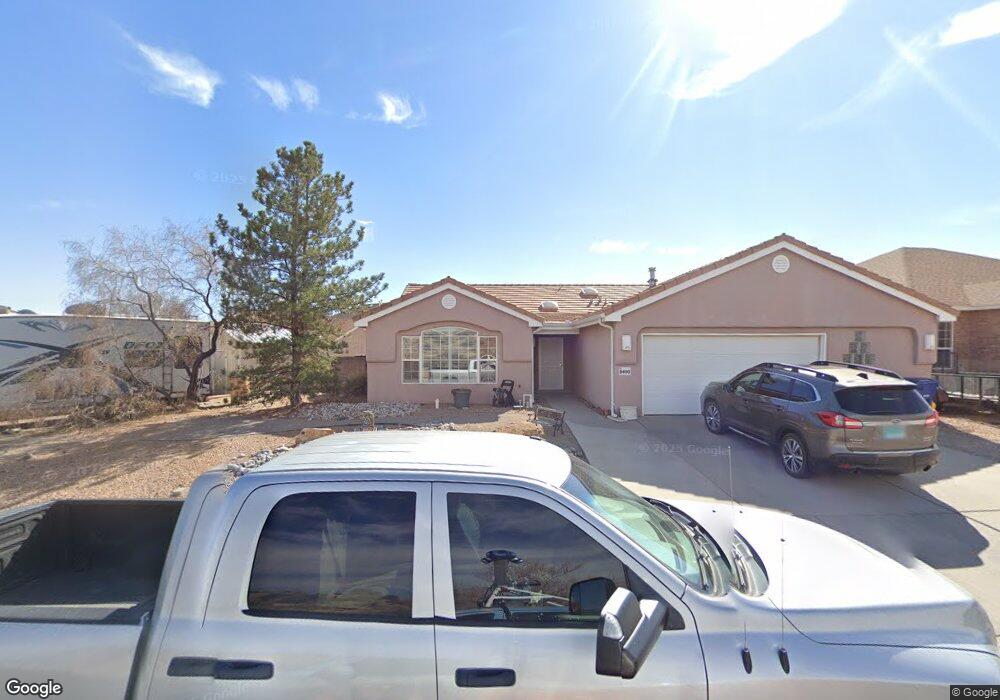
8400 Cedar Creek Place NW Albuquerque, NM 87120
Taylor Ranch NeighborhoodEstimated Value: $396,000 - $468,000
3
Beds
2
Baths
1,941
Sq Ft
$222/Sq Ft
Est. Value
About This Home
This home is located at 8400 Cedar Creek Place NW, Albuquerque, NM 87120 and is currently estimated at $430,284, approximately $221 per square foot. 8400 Cedar Creek Place NW is a home located in Bernalillo County with nearby schools including Chamiza Elementary School, L.B. Johnson Middle School, and Volcano Vista High School.
Ownership History
Date
Name
Owned For
Owner Type
Purchase Details
Closed on
Jul 29, 2010
Sold by
Mckinnon Mark M and Mckinnon Nancy L
Bought by
Carter Eva M and Jaramillo Dion T
Current Estimated Value
Purchase Details
Closed on
Jul 19, 2005
Sold by
Collis Randy and Collis Donna
Bought by
Mckinnon Mark M and Mckinnon Nancy L
Purchase Details
Closed on
Mar 31, 2000
Sold by
Roberson Construction Company Inc
Bought by
Collis Randy and Collis Donna
Purchase Details
Closed on
Dec 28, 1999
Sold by
Sandia Properties Ltd Co
Bought by
Roberson Construction Company
Create a Home Valuation Report for This Property
The Home Valuation Report is an in-depth analysis detailing your home's value as well as a comparison with similar homes in the area
Home Values in the Area
Average Home Value in this Area
Purchase History
| Date | Buyer | Sale Price | Title Company |
|---|---|---|---|
| Carter Eva M | -- | Stewart Title | |
| Carter Eva M | -- | Stewart Title | |
| Mckinnon Mark M | -- | Fidelity Natl Title Ins Co | |
| Mckinnon Mark M | -- | Fidelity Natl Title Ins Co | |
| Collis Randy | -- | Fidelity National Title Co | |
| Collis Randy | -- | Fidelity National Title Co | |
| Roberson Construction Company | -- | Fidelity National Title | |
| Roberson Construction Company | -- | Fidelity National Title |
Source: Public Records
Tax History Compared to Growth
Tax History
| Year | Tax Paid | Tax Assessment Tax Assessment Total Assessment is a certain percentage of the fair market value that is determined by local assessors to be the total taxable value of land and additions on the property. | Land | Improvement |
|---|---|---|---|---|
| 2025 | $3,987 | $99,388 | $21,321 | $78,067 |
| 2024 | $3,987 | $96,493 | $20,700 | $75,793 |
| 2023 | $3,918 | $93,682 | $20,097 | $73,585 |
| 2022 | $3,784 | $90,954 | $19,512 | $71,442 |
| 2021 | $3,739 | $88,305 | $18,944 | $69,361 |
| 2020 | $3,677 | $85,733 | $18,392 | $67,341 |
| 2019 | $3,569 | $83,237 | $17,857 | $65,380 |
| 2018 | $3,443 | $83,237 | $17,857 | $65,380 |
| 2017 | $3,337 | $80,813 | $17,337 | $63,476 |
| 2016 | $3,042 | $71,510 | $17,337 | $54,173 |
| 2015 | $69,427 | $69,427 | $16,832 | $52,595 |
| 2014 | -- | $69,427 | $16,832 | $52,595 |
| 2013 | -- | $69,427 | $16,832 | $52,595 |
Source: Public Records
Map
Nearby Homes
- 4515 Millwood Ct NW
- 4820 Summersville Dr NW
- 4600 Waynesboro Place NW
- 4512 Waynesboro Rd NW
- 7939 Independence Dr NW
- 7824 Snowberry St NW
- 7809 Juneberry St NW
- 4320 La Paloma Rd NW
- 7739 Ridgeview Dr NW
- 0 Calle Nortena North W
- 4309 Rancho Largo Rd NW
- 4300 Ridgemont Ave NW
- 7708 Ridgeview Dr NW
- 9232 Jill Patricia St NW
- 7557 Richmond Hill Rd NW
- 7516 Wells Fargo Trail NW
- 7532 Deerfield Rd NW
- 0 Paseo Del Norte Calle Nortena NW Unit 1092224
- 8100 Rancho Viejo Ct NW
- 9323 Seneca Dr NW
- 8400 Cedar Creek Dr
- 8404 Cedar Creek Place NW
- 4505 Martinsburg Rd NW
- 4509 Martinsburg Rd NW
- 4501 Martinsburg Rd NW
- 8408 Cedar Creek Place NW
- 4515 Martinsburg Rd NW
- 8412 Cedar Creek Place NW
- 8408 Front Royal Ct NW
- 4519 Martinsburg Rd NW
- 8416 Front Royal Ct NW
- 4504 Martinsburg Rd NW
- 4500 Martinsburg Rd NW
- 4508 Martinsburg Rd NW
- 8416 Cedar Creek Place NW
- 4512 Martinsburg Rd NW
- 8420 Cedar Creek Place NW
- 4516 Martinsburg Rd NW
- 8323 Cedar Creek Dr NW
- 8405 Front Royal Ct NW