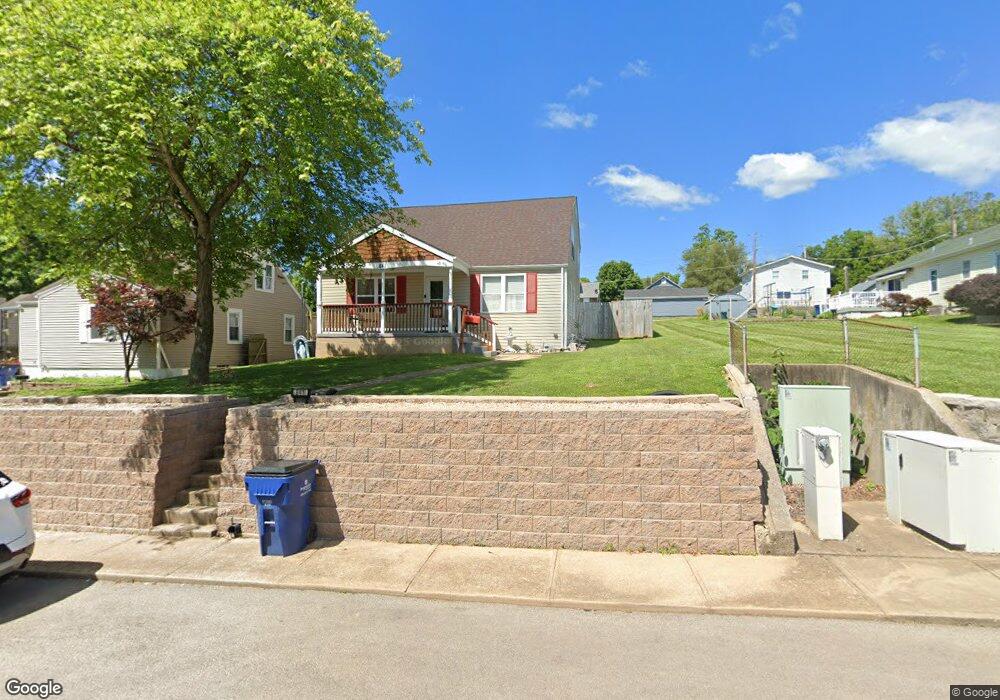
841 Ann St Festus, MO 63028
Festus/Crystal City NeighborhoodEstimated Value: $212,965 - $265,000
Studio
1
Bath
1,216
Sq Ft
$192/Sq Ft
Est. Value
About This Home
This home is located at 841 Ann St, Festus, MO 63028 and is currently estimated at $233,491, approximately $192 per square foot. 841 Ann St is a home located in Jefferson County with nearby schools including Festus Elementary School, Festus Intermediate School, and Festus Middle School.
Ownership History
Date
Name
Owned For
Owner Type
Purchase Details
Closed on
Dec 26, 2003
Sold by
Jones K Denise and Jones Karen Denise
Bought by
Crim Thomas and Crim Donna
Current Estimated Value
Home Financials for this Owner
Home Financials are based on the most recent Mortgage that was taken out on this home.
Original Mortgage
$82,500
Outstanding Balance
$43,361
Interest Rate
7.84%
Mortgage Type
Purchase Money Mortgage
Estimated Equity
$190,130
Purchase Details
Closed on
May 10, 2000
Sold by
Ge Capital Mtg Services
Bought by
Jones K Denise and Jones Karen Denise
Home Financials for this Owner
Home Financials are based on the most recent Mortgage that was taken out on this home.
Original Mortgage
$43,600
Interest Rate
8.13%
Purchase Details
Closed on
Jul 15, 1999
Sold by
Lipe Deborah A and Mortgage Resources Inc
Bought by
Ge Capital Mtg Services
Purchase Details
Closed on
Mar 19, 1999
Sold by
Compu Tax Inc
Bought by
Lipe Deborah A
Create a Home Valuation Report for This Property
The Home Valuation Report is an in-depth analysis detailing your home's value as well as a comparison with similar homes in the area
Home Values in the Area
Average Home Value in this Area
Purchase History
| Date | Buyer | Sale Price | Title Company |
|---|---|---|---|
| Crim Thomas | -- | -- | |
| Jones K Denise | -- | Commonwealth Title | |
| Ge Capital Mtg Services | $59,900 | -- | |
| Lipe Deborah A | -- | -- |
Source: Public Records
Mortgage History
| Date | Status | Borrower | Loan Amount |
|---|---|---|---|
| Open | Crim Thomas | $82,500 | |
| Previous Owner | Jones K Denise | $43,600 |
Source: Public Records
Tax History
| Year | Tax Paid | Tax Assessment Tax Assessment Total Assessment is a certain percentage of the fair market value that is determined by local assessors to be the total taxable value of land and additions on the property. | Land | Improvement |
|---|---|---|---|---|
| 2025 | $1,115 | $21,400 | $1,500 | $19,900 |
| 2024 | $1,115 | $19,700 | $1,500 | $18,200 |
| 2023 | $1,115 | $19,700 | $1,500 | $18,200 |
| 2022 | $1,109 | $19,700 | $1,500 | $18,200 |
| 2021 | $1,110 | $19,700 | $1,500 | $18,200 |
| 2020 | $1,064 | $17,700 | $1,200 | $16,500 |
| 2019 | $1,064 | $17,700 | $1,200 | $16,500 |
| 2018 | $959 | $17,700 | $1,200 | $16,500 |
| 2017 | $959 | $17,700 | $1,200 | $16,500 |
| 2016 | $882 | $16,200 | $1,300 | $14,900 |
| 2015 | $877 | $16,200 | $1,300 | $14,900 |
| 2013 | -- | $15,800 | $1,300 | $14,500 |
Source: Public Records
Map
Nearby Homes
- 129 N 9th St
- 823 Delmar Ave
- 1016 Ann St
- 716 N Mill St
- 722 Delmar Ave
- 601 Warne St
- 617 N 6th St
- 416 Russell Ave
- 1113 Huber St
- 212 N Adams St
- 1001 Parc Central Dr
- 912 Parc Central Dr
- 1824 Oak Dr
- 806 Virginia Ave
- 609 Valentine St
- 122 Northview Dr
- 1648 Flagstaff Dr
- 905 Burgess Ave
- 1107 Burgess Ave
- 407 Jefferson Ave
Your Personal Tour Guide
Ask me questions while you tour the home.