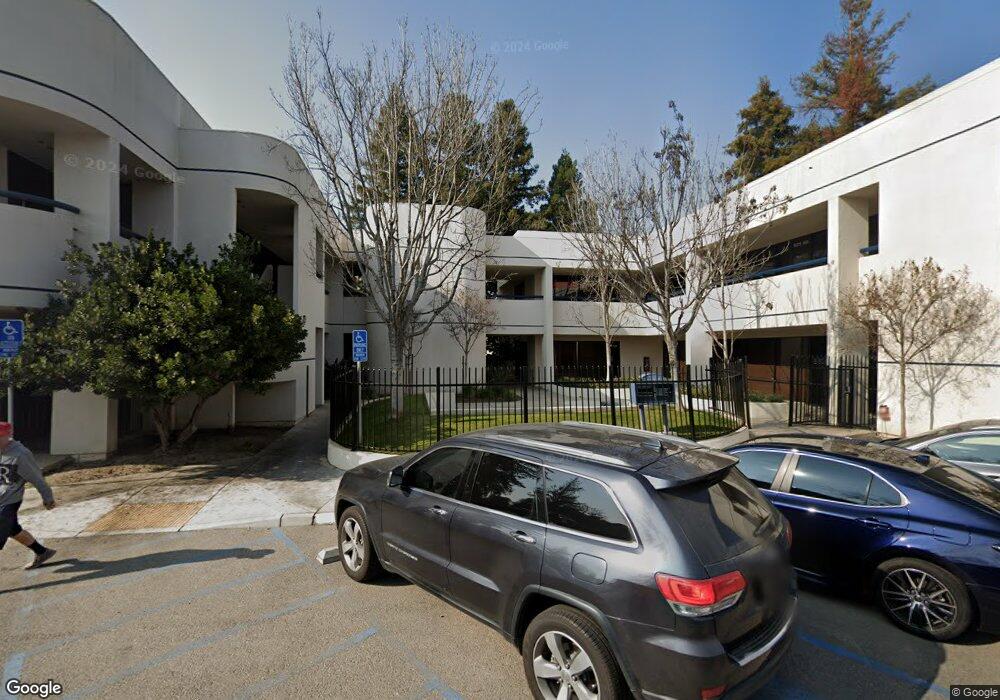
841 Mohawk St Bakersfield, CA 93309
Park Stockdale NeighborhoodEstimated Value: $2,238,855
Studio
--
Bath
14,175
Sq Ft
$158/Sq Ft
Est. Value
About This Home
This home is located at 841 Mohawk St, Bakersfield, CA 93309 and is currently estimated at $2,238,855, approximately $157 per square foot. 841 Mohawk St is a home located in Kern County with nearby schools including Wayne Van Horn Elementary School, O.J. Actis Junior High School, and Bakersfield High School.
Ownership History
Date
Name
Owned For
Owner Type
Purchase Details
Closed on
Jan 10, 2023
Sold by
Mirasol Investments Llc
Bought by
Kern Ag Partners Inc
Current Estimated Value
Purchase Details
Closed on
Jan 14, 2013
Sold by
Jay Llc
Bought by
Mirasol Investment Llc
Purchase Details
Closed on
Sep 12, 2007
Sold by
Price Brett L
Bought by
Jay Llc
Purchase Details
Closed on
Feb 11, 2000
Sold by
Price Deana J
Bought by
Price Brett L
Purchase Details
Closed on
May 1, 1995
Sold by
Glendale Federal Bank Fsb
Bought by
Price Brett L and Price Deana J
Home Financials for this Owner
Home Financials are based on the most recent Mortgage that was taken out on this home.
Original Mortgage
$832,000
Interest Rate
8.47%
Mortgage Type
Seller Take Back
Purchase Details
Closed on
Dec 30, 1994
Sold by
I & M Partnership
Bought by
Glendale Federal Bank Fsb
Create a Home Valuation Report for This Property
The Home Valuation Report is an in-depth analysis detailing your home's value as well as a comparison with similar homes in the area
Home Values in the Area
Average Home Value in this Area
Purchase History
| Date | Buyer | Sale Price | Title Company |
|---|---|---|---|
| Kern Ag Partners Inc | $2,025,000 | Placer Title | |
| Mirasol Investment Llc | $60,000 | Ticor Title Company Of Ca | |
| Jay Llc | -- | Chicago Title Company | |
| Price Brett L | -- | -- | |
| Price Brett L | $1,040,000 | Heritage Title Company | |
| Glendale Federal Bank Fsb | $1,087,000 | Stewart Title |
Source: Public Records
Mortgage History
| Date | Status | Borrower | Loan Amount |
|---|---|---|---|
| Previous Owner | Price Brett L | $832,000 |
Source: Public Records
Tax History
| Year | Tax Paid | Tax Assessment Tax Assessment Total Assessment is a certain percentage of the fair market value that is determined by local assessors to be the total taxable value of land and additions on the property. | Land | Improvement |
|---|---|---|---|---|
| 2025 | $25,209 | $2,106,810 | $884,340 | $1,222,470 |
| 2024 | $25,209 | $2,065,500 | $867,000 | $1,198,500 |
| 2023 | $27,901 | $2,266,606 | $710,162 | $1,556,444 |
| 2022 | $26,877 | $2,222,164 | $696,238 | $1,525,926 |
| 2021 | $26,699 | $2,178,593 | $682,587 | $1,496,006 |
| 2020 | $26,492 | $2,156,255 | $675,588 | $1,480,667 |
| 2019 | $26,182 | $2,156,255 | $675,588 | $1,480,667 |
| 2018 | $24,869 | $2,072,527 | $649,355 | $1,423,172 |
| 2017 | $24,683 | $2,046,195 | $636,623 | $1,409,572 |
| 2016 | $22,848 | $2,007,520 | $624,141 | $1,383,379 |
| 2015 | $22,542 | $1,962,128 | $614,766 | $1,347,362 |
| 2014 | $22,017 | $1,923,694 | $602,724 | $1,320,970 |
Source: Public Records
Map
Nearby Homes
- 5500 Lennox Ave Unit 36
- 5700 Cochran Dr
- 5300 Dunsmuir Rd Unit 20
- 500 Friant Ct
- 5101 Dunsmuir Rd Unit 13
- 5400 Dunsmuir Rd Unit 23
- 5801 Kleinpell Ave
- 5804 Carissa Ave
- 6017 Poso Ct
- 144 Glen Oaks Dr
- 205 Haggin St
- 6212 Friant Dr
- 4425 Charter Oaks Ave
- 109 Bermuda St
- 112 Angell St
- 6206 Stockdale Hwy
- 6212 Stockdale Hwy
- 204 Carr St
- 205 Carr St
- 4300 Garnsey Ln
- 900 Mohawk St
- 901 Mohawk St
- 5100 California Ave Unit STE 202
- 5329 Office Centre Ct Unit 223
- 5500 Lennox Ave Unit 17
- 5500 Lennox Ave Unit 9
- 5500 Lennox Ave Unit 5
- 5500 Lennox Ave Unit 39
- 5500 Lennox Ave Unit 4
- 5500 Lennox Ave Unit 40
- 5500 Lennox Ave Unit 22
- 5500 Lennox Ave Unit 57
- 5500 Lennox Ave Unit 37
- 5500 Lennox Ave Unit 38
- 5500 Lennox Ave Unit 19
- 5500 Lennox Ave Unit 48
- 5500 Lennox Ave Unit 10
- 5500 Lennox Ave Unit 45
- 5500 Lennox Ave Unit 15
- 5500 Lennox Ave Unit 51
Your Personal Tour Guide
Ask me questions while you tour the home.