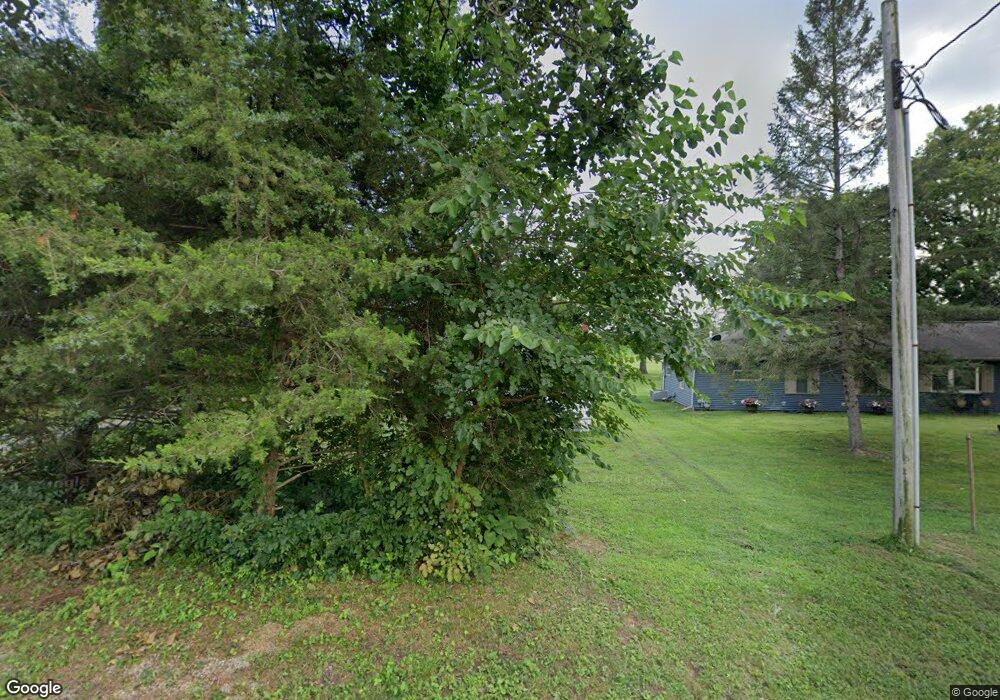
841 Union Meredosia, IL 62665
Estimated Value: $53,134 - $85,000
Studio
--
Bath
696
Sq Ft
$95/Sq Ft
Est. Value
About This Home
This home is located at 841 Union, Meredosia, IL 62665 and is currently estimated at $65,784, approximately $94 per square foot. 841 Union is a home located in Morgan County with nearby schools including Meredosia-Chambersburg Elementary School, Meredosia-Chambersburg Junior High School, and Meredosia-Chambersburg High School.
Ownership History
Date
Name
Owned For
Owner Type
Purchase Details
Closed on
Jul 7, 2022
Sold by
Emily Hall
Bought by
Harnois Stephen and Harnois Betsy
Current Estimated Value
Purchase Details
Closed on
Oct 1, 2021
Sold by
Harnois Betsy and Harnois Stephen
Bought by
Hall Emily
Home Financials for this Owner
Home Financials are based on the most recent Mortgage that was taken out on this home.
Original Mortgage
$64,800
Interest Rate
2.8%
Mortgage Type
Future Advance Clause Open End Mortgage
Purchase Details
Closed on
Mar 15, 2016
Sold by
Luckett Roger F and Luckett Kayla R
Bought by
Harnois Stephen and Harnois Betsy
Purchase Details
Closed on
Jul 3, 2009
Sold by
Smith Justin M
Bought by
Luckett Roger F and Luckett Kayla R
Home Financials for this Owner
Home Financials are based on the most recent Mortgage that was taken out on this home.
Original Mortgage
$8,621
Interest Rate
4.94%
Mortgage Type
New Conventional
Create a Home Valuation Report for This Property
The Home Valuation Report is an in-depth analysis detailing your home's value as well as a comparison with similar homes in the area
Purchase History
| Date | Buyer | Sale Price | Title Company |
|---|---|---|---|
| Harnois Stephen | -- | Rammelkamp Bradney Pc | |
| Hall Emily | $72,000 | Attorney | |
| Harnois Stephen | $10,000 | None Available | |
| Luckett Roger F | $8,000 | None Available |
Source: Public Records
Mortgage History
| Date | Status | Borrower | Loan Amount |
|---|---|---|---|
| Previous Owner | Hall Emily | $64,800 | |
| Previous Owner | Luckett Roger F | $8,621 |
Source: Public Records
Tax History
| Year | Tax Paid | Tax Assessment Tax Assessment Total Assessment is a certain percentage of the fair market value that is determined by local assessors to be the total taxable value of land and additions on the property. | Land | Improvement |
|---|---|---|---|---|
| 2024 | $596 | $5,990 | $1,420 | $4,570 |
| 2023 | $603 | $5,990 | $1,420 | $4,570 |
| 2022 | $597 | $5,990 | $1,420 | $4,570 |
| 2021 | $570 | $5,360 | $1,350 | $4,010 |
| 2020 | $530 | $5,360 | $1,350 | $4,010 |
| 2019 | $571 | $5,660 | $1,350 | $4,310 |
| 2018 | $559 | $5,660 | $1,350 | $4,310 |
| 2017 | $567 | $5,960 | $1,420 | $4,540 |
| 2016 | $809 | $8,560 | $1,160 | $7,400 |
| 2015 | $802 | $8,390 | $1,140 | $7,250 |
| 2014 | $802 | $8,230 | $1,120 | $7,110 |
| 2013 | $769 | $8,230 | $1,120 | $7,110 |
Source: Public Records
Map
Nearby Homes
Your Personal Tour Guide
Ask me questions while you tour the home.