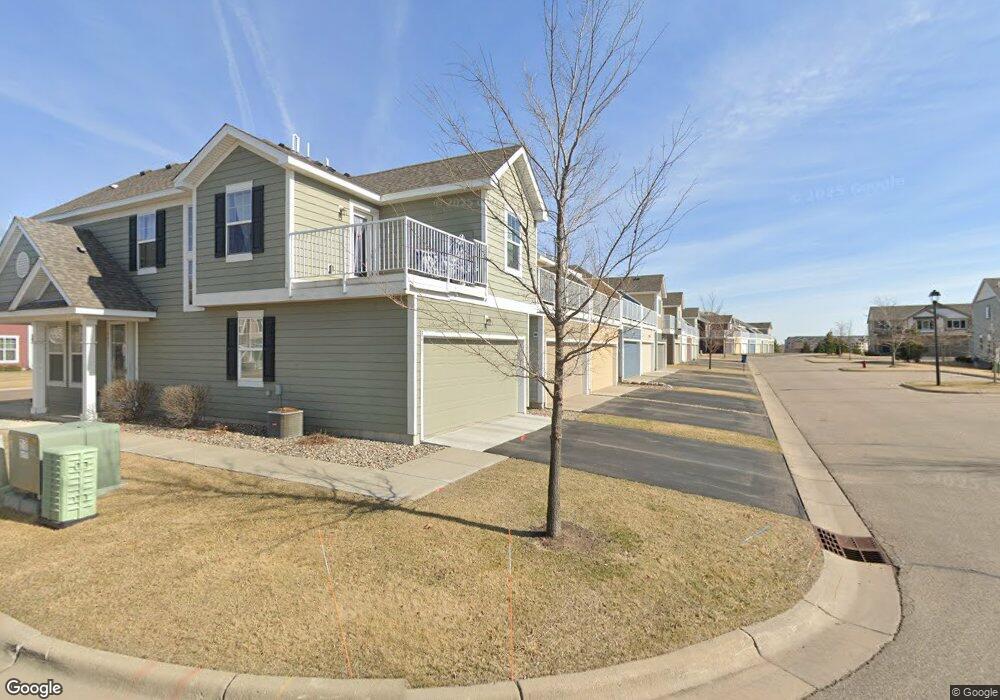
8411 Jonquil Ln N Maple Grove, MN 55369
Estimated Value: $336,142 - $362,000
3
Beds
3
Baths
1,430
Sq Ft
$245/Sq Ft
Est. Value
About This Home
This home is located at 8411 Jonquil Ln N, Maple Grove, MN 55369 and is currently estimated at $350,536, approximately $245 per square foot. 8411 Jonquil Ln N is a home located in Hennepin County with nearby schools including Rice Lake Elementary School, Maple Grove Middle School, and Osseo Senior High School.
Ownership History
Date
Name
Owned For
Owner Type
Purchase Details
Closed on
May 28, 2020
Sold by
Saldutte Thomas J and Saldutte Debra
Bought by
Corrello Taylor Noelle
Current Estimated Value
Home Financials for this Owner
Home Financials are based on the most recent Mortgage that was taken out on this home.
Original Mortgage
$290,900
Outstanding Balance
$257,861
Interest Rate
3.2%
Mortgage Type
New Conventional
Estimated Equity
$92,675
Purchase Details
Closed on
Apr 7, 2017
Sold by
Liu Ian E and Liu Wendy
Bought by
Saldute Thomas J and Saldute Debra
Home Financials for this Owner
Home Financials are based on the most recent Mortgage that was taken out on this home.
Original Mortgage
$248,351
Interest Rate
4.16%
Mortgage Type
New Conventional
Purchase Details
Closed on
Nov 23, 2015
Sold by
Mattamy Minneapolis Llc
Bought by
Liu Tan E and Liu Wendy
Home Financials for this Owner
Home Financials are based on the most recent Mortgage that was taken out on this home.
Original Mortgage
$196,000
Interest Rate
3.74%
Mortgage Type
New Conventional
Create a Home Valuation Report for This Property
The Home Valuation Report is an in-depth analysis detailing your home's value as well as a comparison with similar homes in the area
Home Values in the Area
Average Home Value in this Area
Purchase History
| Date | Buyer | Sale Price | Title Company |
|---|---|---|---|
| Corrello Taylor Noelle | $299,900 | All American Title | |
| Saldute Thomas J | $269,900 | Titlesmart Inc | |
| Liu Tan E | $245,000 | Dca Title |
Source: Public Records
Mortgage History
| Date | Status | Borrower | Loan Amount |
|---|---|---|---|
| Open | Corrello Taylor Noelle | $290,900 | |
| Previous Owner | Saldute Thomas J | $248,351 | |
| Previous Owner | Liu Tan E | $196,000 |
Source: Public Records
Tax History Compared to Growth
Tax History
| Year | Tax Paid | Tax Assessment Tax Assessment Total Assessment is a certain percentage of the fair market value that is determined by local assessors to be the total taxable value of land and additions on the property. | Land | Improvement |
|---|---|---|---|---|
| 2024 | $3,655 | $314,300 | $53,300 | $261,000 |
| 2023 | $3,906 | $338,000 | $51,200 | $286,800 |
| 2022 | $3,355 | $345,700 | $44,900 | $300,800 |
| 2021 | $3,263 | $285,400 | $33,900 | $251,500 |
| 2020 | $3,342 | $273,100 | $31,100 | $242,000 |
| 2019 | $3,307 | $267,700 | $40,000 | $227,700 |
| 2018 | $2,963 | $251,800 | $40,000 | $211,800 |
| 2017 | $3,140 | $214,600 | $52,000 | $162,600 |
| 2016 | $3,056 | $205,700 | $58,000 | $147,700 |
| 2015 | $2,932 | $191,800 | $49,000 | $142,800 |
| 2014 | -- | $5,100 | $5,100 | $0 |
Source: Public Records
Map
Nearby Homes
- 8406 Jonquil Ln N
- 11601 82nd Ave N
- 11879 85th Place N Unit 54
- 11540 81st Place N
- 11462 81st Place N
- 12598 84th Place N
- 8154 Arrowwood Ln N
- 8405 Norwood Ln N
- 8326 Oakview Ct N
- 11631 88th Ave N
- 8704 Cottonwood Ln N
- 11537 88th Ave N
- 12775 82nd Place N
- 11760 88th Place N
- 12509 88th Ave N
- 9058 Goldenrod Ln N
- 14877 106th Ave N
- 9132 Kirkwood Ln N
- 8949 Rosewood Ln N
- 13611 86th Ave N
- 8413 Jonquil Ln N
- 8407 Jonquil Ln N
- 8415 Jonquil Ln N
- 8405 Jonquil Ln N
- 8403 Jonquil Ln N
- 8401 Jonquil Ln N
- 8417 Jonquil Ln N
- 12005 84th Way N
- 8399 Jonquil Ln N
- 8404 Jonquil Ln N
- 8408 Jonquil Ln N
- 8419 Jonquil Ln N
- 8402 Jonquil Ln N
- 8410 Jonquil Ln N
- 8400 Jonquil Ln N
- 8397 Jonquil Ln N
- 8398 Jonquil Ln N
- 12013 84th Way N
- 8421 Jonquil Ln N
- 8395 Jonquil Ln N