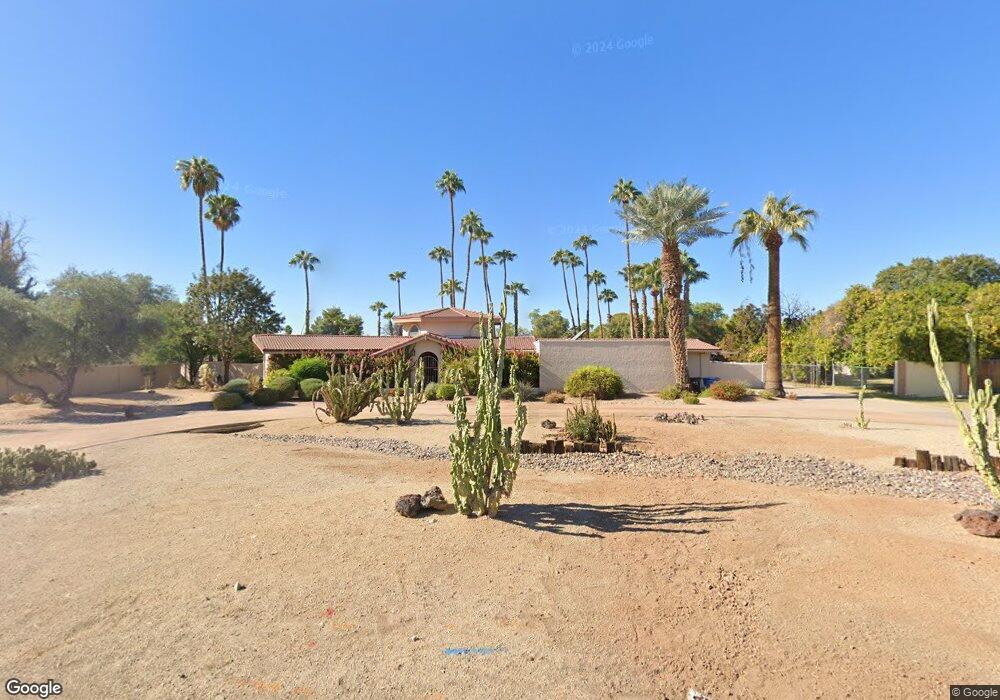
8412 S Jentilly Ln Tempe, AZ 85284
South Tempe NeighborhoodEstimated Value: $972,963 - $1,251,000
--
Bed
4
Baths
3,102
Sq Ft
$367/Sq Ft
Est. Value
About This Home
This home is located at 8412 S Jentilly Ln, Tempe, AZ 85284 and is currently estimated at $1,138,741, approximately $367 per square foot. 8412 S Jentilly Ln is a home located in Maricopa County with nearby schools including C I Waggoner School, Kyrene Middle School, and Corona Del Sol High School.
Ownership History
Date
Name
Owned For
Owner Type
Purchase Details
Closed on
May 10, 2010
Sold by
Southwest Tempe Investments Llc
Bought by
The Hanigsberg Living Trust and Hanigsberg Barbara
Current Estimated Value
Purchase Details
Closed on
Feb 16, 2010
Sold by
Hanigsberg Barbara A
Bought by
Southwest Tempe Investments Llc
Purchase Details
Closed on
Jun 29, 2005
Sold by
Southwest Tempe Investments Llc
Bought by
Hanigsberg Barbara A
Home Financials for this Owner
Home Financials are based on the most recent Mortgage that was taken out on this home.
Original Mortgage
$137,250
Interest Rate
5.58%
Mortgage Type
Fannie Mae Freddie Mac
Purchase Details
Closed on
Mar 24, 2002
Sold by
Hanigsberg John R and Hanigsberg Barbara A
Bought by
Southwest Tempe Investments Llc
Purchase Details
Closed on
May 12, 2000
Sold by
Hanigsberg John and Hanigsberg Barbara
Bought by
Hanigsberg John and Hanigsberg Barbara
Create a Home Valuation Report for This Property
The Home Valuation Report is an in-depth analysis detailing your home's value as well as a comparison with similar homes in the area
Home Values in the Area
Average Home Value in this Area
Purchase History
| Date | Buyer | Sale Price | Title Company |
|---|---|---|---|
| The Hanigsberg Living Trust | -- | None Available | |
| Southwest Tempe Investments Llc | -- | None Available | |
| Hanigsberg Barbara A | -- | Stewart Title & Trust Of Pho | |
| Southwest Tempe Investments Llc | -- | -- | |
| Hanigsberg John | -- | -- | |
| Hanigsberg John | -- | -- |
Source: Public Records
Mortgage History
| Date | Status | Borrower | Loan Amount |
|---|---|---|---|
| Previous Owner | Hanigsberg Barbara A | $137,250 |
Source: Public Records
Tax History Compared to Growth
Tax History
| Year | Tax Paid | Tax Assessment Tax Assessment Total Assessment is a certain percentage of the fair market value that is determined by local assessors to be the total taxable value of land and additions on the property. | Land | Improvement |
|---|---|---|---|---|
| 2025 | $6,315 | $63,419 | -- | -- |
| 2024 | $5,940 | $60,399 | -- | -- |
| 2023 | $5,940 | $75,930 | $15,180 | $60,750 |
| 2022 | $5,636 | $65,450 | $13,090 | $52,360 |
| 2021 | $5,776 | $64,210 | $12,840 | $51,370 |
| 2020 | $5,635 | $62,820 | $12,560 | $50,260 |
| 2019 | $5,450 | $62,800 | $12,560 | $50,240 |
| 2018 | $5,266 | $56,380 | $11,270 | $45,110 |
| 2017 | $5,040 | $54,210 | $10,840 | $43,370 |
| 2016 | $5,091 | $54,900 | $10,980 | $43,920 |
| 2015 | $4,648 | $49,680 | $9,930 | $39,750 |
Source: Public Records
Map
Nearby Homes
- 11812 S 71st St
- 935 E Citation Ln
- 7026 E Warner Rd
- 8336 S Homestead Ln
- 8272 S Pecan Grove Cir
- 938 E Knight Ln
- 8276 S Pecan Grove Cir
- 8629 S Stanley Place
- 260 E Rhea Rd
- 8606 S Dorsey Ln
- 929 E Derby Dr
- 12651 S 71st St
- 640 E Vinedo Ln
- 8382 S Mill Ave
- 8938 S Forest Ave
- 1101 E Warner Rd Unit 117
- 8438 S Maple Ave
- 1001 E Caroline Ln
- 1060 E Louis Way Unit 14
- 8578 S Maple Ave
- 902 E El Freda Rd
- 8400 S Jentilly Ln
- 8417 S Jentilly Ln
- 1001 E Buena Vista Dr
- 8326 S Jentilly Ln
- 8425 S Jentilly Ln
- 1003 E Calle Monte Vista
- 8329 S Jentilly Ln
- 11838 S Rural Rd
- 1007 E Buena Vista Dr
- 1012 E El Freda Rd
- 11812 S Rural Rd
- 8323 S Jentilly Ln
- 8314 S Jentilly Ln
- 1001 E El Freda Rd
- 1011 E Calle Monte Vista
- 1011 E Calle Monte Vista
- 12002 S Rural Rd
- 12002 S Rural Rd Unit 13
- 1013 E Buena Vista Dr