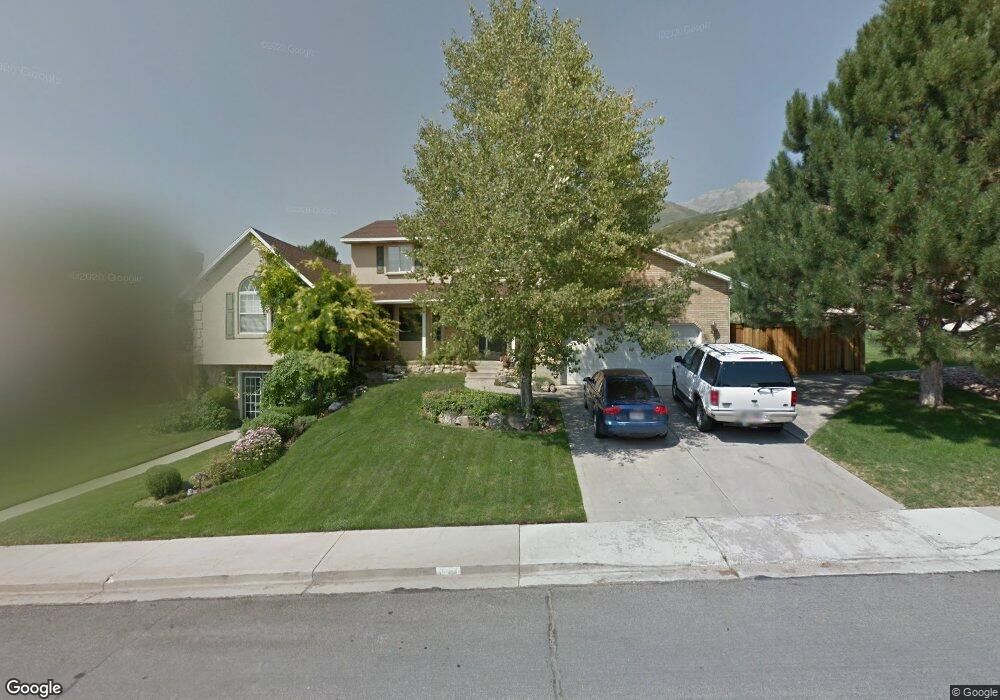
843 Heather Rd Orem, UT 84097
Northridge NeighborhoodEstimated Value: $710,055 - $785,000
7
Beds
4
Baths
3,960
Sq Ft
$186/Sq Ft
Est. Value
About This Home
This home is located at 843 Heather Rd, Orem, UT 84097 and is currently estimated at $737,014, approximately $186 per square foot. 843 Heather Rd is a home located in Utah County with nearby schools including Orchard Elementary School, Oak Canyon Junior High School, and Timpanogos High School.
Ownership History
Date
Name
Owned For
Owner Type
Purchase Details
Closed on
Aug 16, 2023
Sold by
Moss Robin Wayne and Moss Wendy Carlene
Bought by
Mcfadyen Bruce and Mcfadyen Mandy
Current Estimated Value
Purchase Details
Closed on
Sep 17, 2019
Sold by
Partridge Kent L and Partridge Denise K
Bought by
Moss Robin Wayne
Home Financials for this Owner
Home Financials are based on the most recent Mortgage that was taken out on this home.
Original Mortgage
$350,000
Interest Rate
3.6%
Mortgage Type
New Conventional
Purchase Details
Closed on
Sep 13, 2019
Sold by
Moss Robin Wayne
Bought by
Moss Robin Wayne and Moss Wendy Carlene
Home Financials for this Owner
Home Financials are based on the most recent Mortgage that was taken out on this home.
Original Mortgage
$350,000
Interest Rate
3.6%
Mortgage Type
New Conventional
Create a Home Valuation Report for This Property
The Home Valuation Report is an in-depth analysis detailing your home's value as well as a comparison with similar homes in the area
Home Values in the Area
Average Home Value in this Area
Purchase History
| Date | Buyer | Sale Price | Title Company |
|---|---|---|---|
| Mcfadyen Bruce | -- | Meridian Title Company | |
| Moss Robin Wayne | -- | United West Title | |
| Moss Robin Wayne | -- | Accommodation |
Source: Public Records
Mortgage History
| Date | Status | Borrower | Loan Amount |
|---|---|---|---|
| Previous Owner | Moss Robin Wayne | $350,000 |
Source: Public Records
Tax History
| Year | Tax Paid | Tax Assessment Tax Assessment Total Assessment is a certain percentage of the fair market value that is determined by local assessors to be the total taxable value of land and additions on the property. | Land | Improvement |
|---|---|---|---|---|
| 2025 | $2,737 | $369,930 | -- | -- |
| 2024 | $2,737 | $334,730 | $0 | $0 |
| 2023 | $2,595 | $341,055 | $0 | $0 |
| 2022 | $2,694 | $343,035 | $0 | $0 |
| 2021 | $2,441 | $470,800 | $175,500 | $295,300 |
| 2020 | $2,289 | $433,800 | $152,600 | $281,200 |
| 2019 | $1,961 | $386,500 | $142,000 | $244,500 |
| 2018 | $1,883 | $354,600 | $142,000 | $212,600 |
| 2017 | $1,799 | $181,500 | $0 | $0 |
| 2016 | $1,943 | $180,730 | $0 | $0 |
| 2015 | $1,892 | $166,485 | $0 | $0 |
| 2014 | $1,843 | $161,425 | $0 | $0 |
Source: Public Records
Map
Nearby Homes
- 695 E 1870 N
- 110 S 1320 E
- 1643 N Mountain Oaks Dr
- 540 E Quail Rd
- 442 E 1730 N
- 713 E 1500 St N Unit 19
- 723 E 1450 N Unit 25
- 1366 N 750 E
- 1356 N 750 E Unit 11
- 713 E 1450 N Unit 23
- 733 E 1450 N Unit 5
- 1324 N 750 E Unit 3
- 98 S 1025 E
- 1480 N 430 E
- 1051 E 100 N
- 1636 N 160 E
- 710 E 1280 N
- 1638 N 160 E
- 558 E 1265 N
- 363 E 1395 N Unit 22
- 829 Heather Rd
- 857 Heather Rd
- 840 Heather Rd
- 828 Heather Rd
- 815 Heather Rd
- 1967 Heather Rd
- 842 Heather Rd
- 814 Heather Rd
- 801 Heather Rd
- 844 Heather Rd
- 1978 Heather Rd
- 1968 Heather Rd Unit 3
- 1968 Heather Rd
- 787 E Heather Rd
- 787 Heather Rd
- 1935 Heather Rd
- 1930 Skyline Dr
- 1942 Skyline Dr
- 1942 Heather Rd Unit 4
- 1942 Heather Rd
Your Personal Tour Guide
Ask me questions while you tour the home.