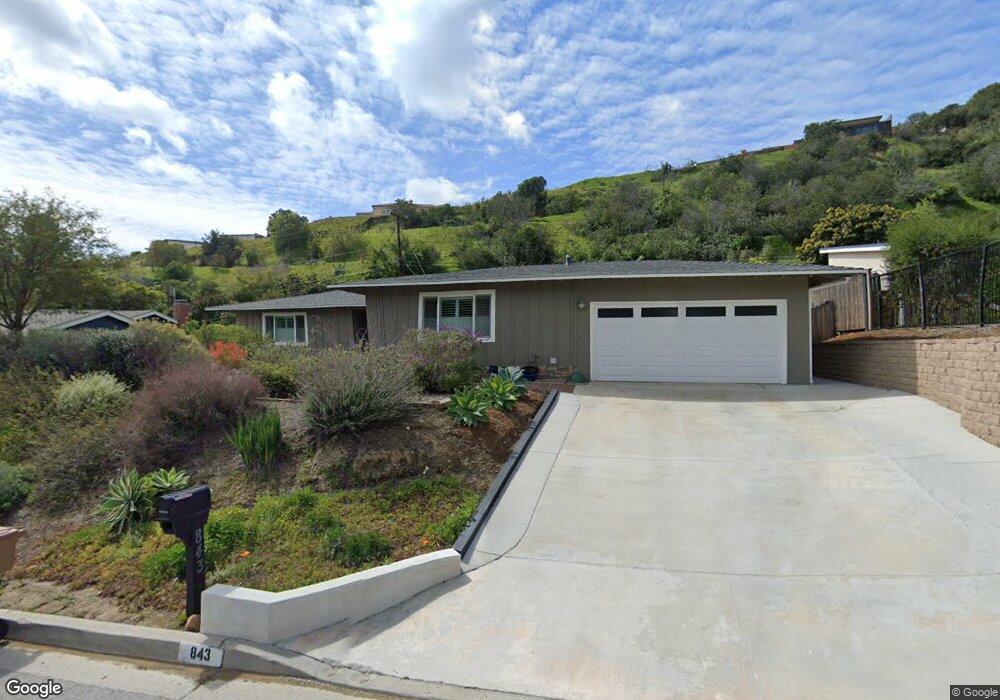
843 Via Arroyo Ventura, CA 93003
Poinsettia NeighborhoodEstimated Value: $1,239,064 - $1,367,000
5
Beds
3
Baths
2,046
Sq Ft
$643/Sq Ft
Est. Value
About This Home
This home is located at 843 Via Arroyo, Ventura, CA 93003 and is currently estimated at $1,314,766, approximately $642 per square foot. 843 Via Arroyo is a home located in Ventura County with nearby schools including Poinsettia Elementary School, Cabrillo Middle School, and Ventura High School.
Ownership History
Date
Name
Owned For
Owner Type
Purchase Details
Closed on
Jan 25, 2011
Sold by
U S Bank Na
Bought by
Happle Scott and Happle Amanda C
Current Estimated Value
Home Financials for this Owner
Home Financials are based on the most recent Mortgage that was taken out on this home.
Original Mortgage
$408,000
Interest Rate
4.83%
Mortgage Type
New Conventional
Purchase Details
Closed on
Jul 26, 2010
Sold by
Ledezma Martin and Ledezma Elba A
Bought by
Us Bank Na
Purchase Details
Closed on
Jan 3, 2006
Sold by
Ledezma Martin
Bought by
Ledezma Martin and Ledezma Elba A
Home Financials for this Owner
Home Financials are based on the most recent Mortgage that was taken out on this home.
Original Mortgage
$650,000
Interest Rate
5.87%
Mortgage Type
Purchase Money Mortgage
Purchase Details
Closed on
Jun 3, 2005
Sold by
Ferguson James P and Ferguson Darla L
Bought by
Ledezma Martin
Create a Home Valuation Report for This Property
The Home Valuation Report is an in-depth analysis detailing your home's value as well as a comparison with similar homes in the area
Home Values in the Area
Average Home Value in this Area
Purchase History
| Date | Buyer | Sale Price | Title Company |
|---|---|---|---|
| Happle Scott | $510,000 | Landsafe Title Of California | |
| Us Bank Na | $612,112 | Landsafe Title | |
| Ledezma Martin | -- | First American Title Company | |
| Ledezma Martin | -- | -- |
Source: Public Records
Mortgage History
| Date | Status | Borrower | Loan Amount |
|---|---|---|---|
| Previous Owner | Happle Scott | $408,000 | |
| Previous Owner | Ledezma Martin | $650,000 |
Source: Public Records
Tax History Compared to Growth
Tax History
| Year | Tax Paid | Tax Assessment Tax Assessment Total Assessment is a certain percentage of the fair market value that is determined by local assessors to be the total taxable value of land and additions on the property. | Land | Improvement |
|---|---|---|---|---|
| 2025 | $6,948 | $653,387 | $358,725 | $294,662 |
| 2024 | $6,948 | $640,576 | $351,691 | $288,885 |
| 2023 | $6,869 | $628,016 | $344,795 | $283,221 |
| 2022 | $6,381 | $615,702 | $338,034 | $277,668 |
| 2021 | $6,270 | $603,630 | $331,406 | $272,224 |
| 2020 | $6,211 | $597,442 | $328,008 | $269,434 |
| 2019 | $6,097 | $585,728 | $321,577 | $264,151 |
| 2018 | $5,590 | $535,398 | $315,272 | $220,126 |
| 2017 | $5,882 | $562,986 | $309,091 | $253,895 |
| 2016 | $5,777 | $551,948 | $303,031 | $248,917 |
| 2015 | $5,683 | $543,659 | $298,480 | $245,179 |
| 2014 | $5,601 | $533,011 | $292,634 | $240,377 |
Source: Public Records
Map
Nearby Homes
- 872 Via Arroyo
- 708 Skyview Terrace
- 887 Via Ondulando
- 259 Via Pasito
- 691 Via Ondulando
- 1018 Via Arroyo
- 683 Colina Vista
- 961 Colina Vista
- 978 Colina Vista
- 801 High Point Dr
- 1161 Via Arroyo
- 7017 Sonora Ct
- 6153 Cobblestone Dr
- 6174 Cobblestone Dr
- 1251 Via Cielito
- 6005 Sutter St
- 146 Donner Ave
- 159 Donner Ave
- 91 Mount Whitney Ct
- 191 Harborview Ct
- 821 Via Arroyo
- 865 Via Arroyo
- 873 Via Arroyo
- 785 Via Arroyo
- 844 Via Arroyo
- 822 Via Arroyo
- 763 Via Arroyo
- 891 Via Arroyo
- 866 Via Arroyo
- 888 Via Arroyo
- 686 Skyview Terrace
- 762 Via Arroyo
- 721 Via Arroyo
- 895 Via Arroyo
- 892 Via Arroyo
- 290 Via Pasito
- 660 Skyview Terrace
- 687 Skyview Terrace
- 748 Via Arroyo
- 799 Via Ondulando