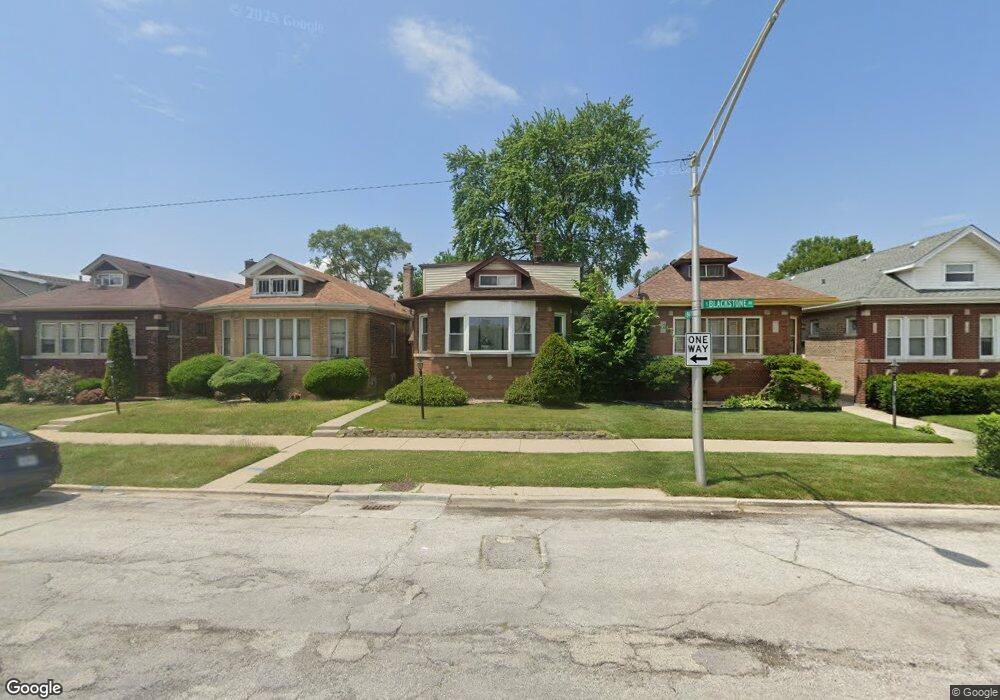
8430 S Blackstone Ave Chicago, IL 60619
Calumet Heights NeighborhoodEstimated Value: $251,783 - $330,000
3
Beds
3
Baths
2,347
Sq Ft
$130/Sq Ft
Est. Value
About This Home
This home is located at 8430 S Blackstone Ave, Chicago, IL 60619 and is currently estimated at $304,696, approximately $129 per square foot. 8430 S Blackstone Ave is a home located in Cook County with nearby schools including Caldwell Elementary Academy, Mcdowell Elementary School, and CICS Avalon.
Ownership History
Date
Name
Owned For
Owner Type
Purchase Details
Closed on
Oct 31, 2011
Sold by
Colbon Shyril L
Bought by
Harris Laquashia
Current Estimated Value
Home Financials for this Owner
Home Financials are based on the most recent Mortgage that was taken out on this home.
Original Mortgage
$113,059
Outstanding Balance
$78,657
Interest Rate
4.75%
Mortgage Type
FHA
Estimated Equity
$226,039
Purchase Details
Closed on
Feb 21, 2005
Sold by
Suburban Bank & Trust Co
Bought by
Colbon Shyril L
Purchase Details
Closed on
Dec 9, 2003
Sold by
Colbon Shyril L
Bought by
Suburban Bank & Trust Co and Trust #743419
Purchase Details
Closed on
Sep 17, 2003
Sold by
Jones John W and Jones Barbara Hardy
Bought by
Colbon Shyril L
Home Financials for this Owner
Home Financials are based on the most recent Mortgage that was taken out on this home.
Original Mortgage
$113,250
Interest Rate
8.87%
Mortgage Type
Adjustable Rate Mortgage/ARM
Purchase Details
Closed on
Oct 16, 1998
Sold by
Jones Yvonne A
Bought by
Jones John W
Create a Home Valuation Report for This Property
The Home Valuation Report is an in-depth analysis detailing your home's value as well as a comparison with similar homes in the area
Home Values in the Area
Average Home Value in this Area
Purchase History
| Date | Buyer | Sale Price | Title Company |
|---|---|---|---|
| Harris Laquashia | $116,000 | Fidelity National Title | |
| Colbon Shyril L | -- | -- | |
| Suburban Bank & Trust Co | -- | -- | |
| Colbon Shyril L | $151,000 | Pntn | |
| Jones John W | -- | -- |
Source: Public Records
Mortgage History
| Date | Status | Borrower | Loan Amount |
|---|---|---|---|
| Open | Harris Laquashia | $113,059 | |
| Previous Owner | Colbon Shyril L | $113,250 |
Source: Public Records
Tax History Compared to Growth
Tax History
| Year | Tax Paid | Tax Assessment Tax Assessment Total Assessment is a certain percentage of the fair market value that is determined by local assessors to be the total taxable value of land and additions on the property. | Land | Improvement |
|---|---|---|---|---|
| 2025 | $3,098 | $17,101 | $2,813 | $14,288 |
| 2024 | $3,098 | $17,101 | $2,813 | $14,288 |
| 2023 | $2,999 | $18,001 | $4,688 | $13,313 |
| 2022 | $2,999 | $18,001 | $4,688 | $13,313 |
| 2021 | $2,950 | $17,999 | $4,687 | $13,312 |
| 2020 | $2,602 | $14,784 | $3,375 | $11,409 |
| 2019 | $2,611 | $16,427 | $3,375 | $13,052 |
| 2018 | $2,566 | $16,427 | $3,375 | $13,052 |
| 2017 | $3,154 | $18,027 | $3,000 | $15,027 |
| 2016 | $3,110 | $18,027 | $3,000 | $15,027 |
| 2015 | $2,823 | $18,027 | $3,000 | $15,027 |
| 2014 | $2,519 | $16,146 | $2,625 | $13,521 |
| 2013 | $2,458 | $16,146 | $2,625 | $13,521 |
Source: Public Records
Map
Nearby Homes
- 8429 S Dante Ave
- 8344 S Blackstone Ave
- 8344 S Stony Island Ave
- 8621 S Dante Ave
- 1534 E 86th Place
- 8640 S Blackstone Ave
- 8312 S Kenwood Ave
- 1350 E 87th St
- 8200 S Harper Ave
- 1706 E 83rd St
- 1707 E 83rd St
- 1711 E 83rd St
- 1727 E 83rd Place
- 1730 E 83rd Place
- 1300 E 87th St
- 8227 S Avalon Ave
- 8751 S Blackstone Ave
- 8646 S University Ave
- 8235 S Woodlawn Ave
- 8325 S Cregier Ave
- 8428 S Blackstone Ave
- 8424 S Blackstone Ave
- 8436 S Blackstone Ave
- 8436 S Blackstone Ave
- 8422 S Blackstone Ave
- 8440 S Blackstone Ave
- 8418 S Blackstone Ave
- 8431 S Dante Ave
- 8435 S Dante Ave
- 8416 S Blackstone Ave
- 8446 S Blackstone Ave
- 8439 S Blackstone Ave
- 8425 S Dante Ave
- 8439 S Dante Ave
- 8423 S Dante Ave
- 8441 S Dante Ave
- 8412 S Blackstone Ave
- 8448 S Blackstone Ave
- 1500 E 84th Place