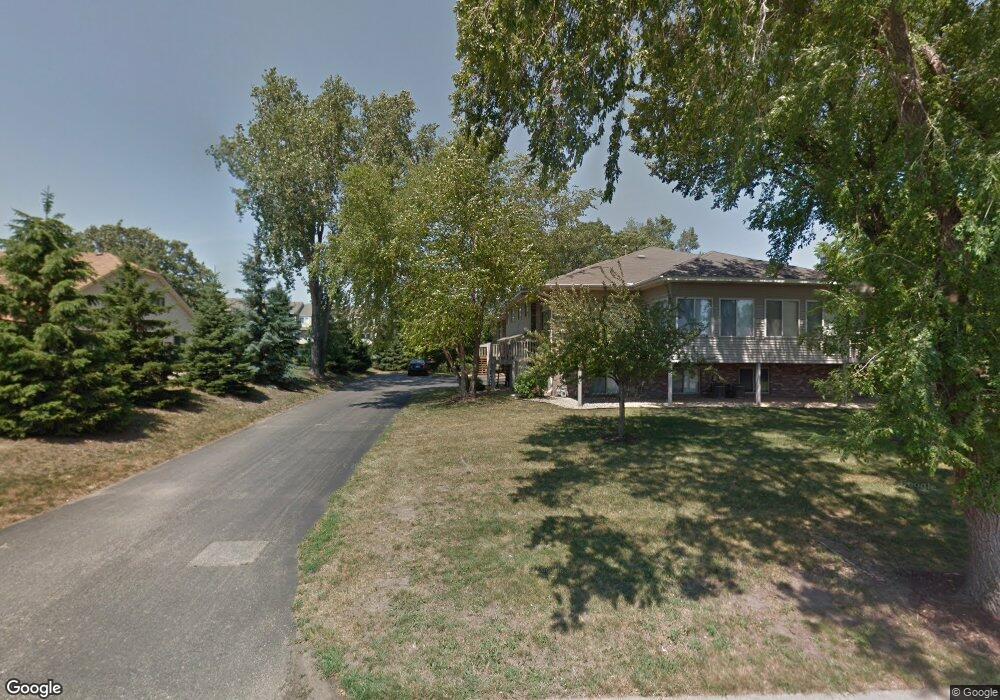
8437 8437 144th-Street-w Apple Valley, MN 55124
Alimagnet NeighborhoodEstimated Value: $261,145 - $275,000
2
Beds
2
Baths
1,086
Sq Ft
$245/Sq Ft
Est. Value
About This Home
This home is located at 8437 8437 144th-Street-w, Apple Valley, MN 55124 and is currently estimated at $266,286, approximately $245 per square foot. 8437 8437 144th-Street-w is a home located in Dakota County with nearby schools including Westview Elementary School, Valley Middle School, and Apple Valley Senior High School.
Ownership History
Date
Name
Owned For
Owner Type
Purchase Details
Closed on
Feb 26, 2016
Sold by
Kuphal Kyle and Kuphal Eric
Bought by
Quam Gaylen J and Neth Laura M
Current Estimated Value
Home Financials for this Owner
Home Financials are based on the most recent Mortgage that was taken out on this home.
Original Mortgage
$140,000
Outstanding Balance
$111,395
Interest Rate
3.81%
Mortgage Type
New Conventional
Estimated Equity
$154,891
Purchase Details
Closed on
Jun 27, 2008
Sold by
Larson Brian A and Larson Rachel L
Bought by
Rhode Kyla
Home Financials for this Owner
Home Financials are based on the most recent Mortgage that was taken out on this home.
Original Mortgage
$180,212
Interest Rate
5.75%
Mortgage Type
FHA
Purchase Details
Closed on
Apr 30, 2002
Sold by
Hawkins Lisa K and Hawkins Peter J
Bought by
Larson Brian A and Forde Rachel L
Purchase Details
Closed on
Nov 1, 1999
Sold by
Whitt Michael J and Whitt Suzette L
Bought by
Shepeck Lisa
Create a Home Valuation Report for This Property
The Home Valuation Report is an in-depth analysis detailing your home's value as well as a comparison with similar homes in the area
Home Values in the Area
Average Home Value in this Area
Purchase History
| Date | Buyer | Sale Price | Title Company |
|---|---|---|---|
| Quam Gaylen J | $175,000 | Burnet Title | |
| Rhode Kyla | $182,000 | -- | |
| Larson Brian A | $169,900 | -- | |
| Shepeck Lisa | $130,000 | -- |
Source: Public Records
Mortgage History
| Date | Status | Borrower | Loan Amount |
|---|---|---|---|
| Open | Quam Gaylen J | $140,000 | |
| Previous Owner | Rhode Kyla | $180,212 |
Source: Public Records
Tax History Compared to Growth
Tax History
| Year | Tax Paid | Tax Assessment Tax Assessment Total Assessment is a certain percentage of the fair market value that is determined by local assessors to be the total taxable value of land and additions on the property. | Land | Improvement |
|---|---|---|---|---|
| 2024 | $2,450 | $238,200 | $54,000 | $184,200 |
| 2023 | $2,450 | $227,900 | $52,800 | $175,100 |
| 2022 | $2,094 | $230,200 | $52,700 | $177,500 |
| 2021 | $2,058 | $194,100 | $45,800 | $148,300 |
| 2020 | $2,030 | $187,400 | $43,600 | $143,800 |
| 2019 | $1,772 | $180,100 | $41,500 | $138,600 |
| 2018 | $1,816 | $167,500 | $38,500 | $129,000 |
| 2017 | $1,714 | $164,600 | $35,600 | $129,000 |
| 2016 | $1,727 | $150,100 | $33,900 | $116,200 |
| 2015 | $1,665 | $125,933 | $28,013 | $97,920 |
| 2014 | -- | $122,336 | $25,654 | $96,682 |
| 2013 | -- | $116,559 | $22,800 | $93,759 |
Source: Public Records
Map
Nearby Homes
- 14350 Hickory Way
- 441 Walnut Ln
- 14208 Heritage Ln
- 8681 144th Street Ct
- 249 Elm Dr
- 14132 Heywood Path
- 148 Spruce Dr
- 14786 Hallmark Dr
- 13910 Herald Ct
- 13902 Herald Way
- 14709 White Oak Dr
- 13780 Hanover Way
- 13761 Hollybrook Cir
- 13751 Hollybrook Cir
- 13731 Hollybrook Cir
- 13727 Hollybrook Cir
- The Magnolia Plan at Eagle Pointe - Townhomes
- The Sophia Plan at Eagle Pointe - Townhomes
- The Amelia Plan at Eagle Pointe - Townhomes
- The Nolan Plan at Eagle Pointe - Townhomes
- 8437 144th St W
- 8435 8435 144th-Street-w
- 8431 144th St W
- 8435 144th St W
- 8433 144th St W
- 8461 144th St W
- 8411 144th St W
- 8407 144th St W
- 14381 14381 Heywood-Avenue-
- 8411 144th St W Unit 2
- 14378 Hickory Way
- 14382 Hickory Way
- 14381 Heywood Ave
- 14386 Hickory Way
- 14385 Hickory Way
- 14387 Hickory Way
- 14389 Hickory Way
- 14390 Hickory Way
- 14391 Hickory Way
- 14370 Hickory Way