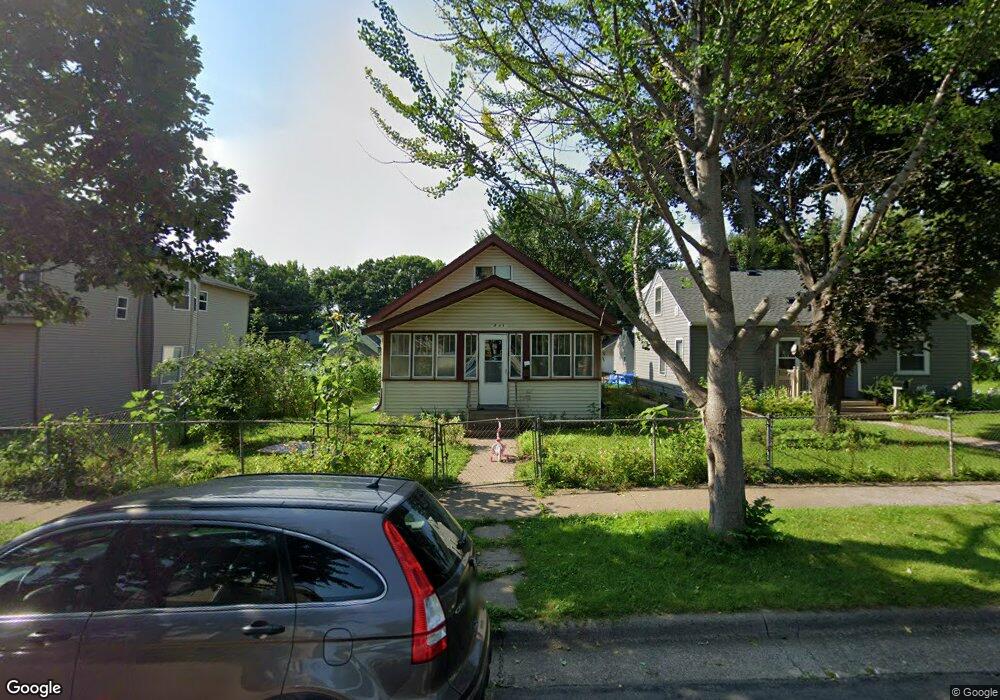
844 844 Sims Ave St. Paul, MN 55106
Payne-Phalen NeighborhoodEstimated Value: $260,000 - $272,000
3
Beds
2
Baths
1,051
Sq Ft
$252/Sq Ft
Est. Value
About This Home
This home is located at 844 844 Sims Ave, St. Paul, MN 55106 and is currently estimated at $264,880, approximately $252 per square foot. 844 844 Sims Ave is a home located in Ramsey County with nearby schools including Frost Lake Elementary School, Txuj Ci HMong Language and Culture Upper Campus, and Johnson Senior High School.
Ownership History
Date
Name
Owned For
Owner Type
Purchase Details
Closed on
Jun 24, 2021
Sold by
Moo Saw Gay and Hlo Sha
Bought by
Ket New Loo and Moo Saw Gay
Current Estimated Value
Home Financials for this Owner
Home Financials are based on the most recent Mortgage that was taken out on this home.
Original Mortgage
$170,500
Outstanding Balance
$154,367
Interest Rate
2.9%
Mortgage Type
New Conventional
Estimated Equity
$110,514
Purchase Details
Closed on
Dec 14, 2017
Sold by
Yang John and Xiong Mee
Bought by
Moo Saw Gay and Ma Tho
Home Financials for this Owner
Home Financials are based on the most recent Mortgage that was taken out on this home.
Original Mortgage
$171,830
Interest Rate
3.9%
Mortgage Type
FHA
Purchase Details
Closed on
May 15, 2009
Sold by
Us Bank National Association
Bought by
Yang John and Xiong Mee
Purchase Details
Closed on
Aug 28, 2002
Sold by
Thao Houa and Yang Pheng
Bought by
Thao Henry and Lee Der
Purchase Details
Closed on
May 21, 1996
Sold by
Kennedy Margaret
Bought by
Hous Thao
Create a Home Valuation Report for This Property
The Home Valuation Report is an in-depth analysis detailing your home's value as well as a comparison with similar homes in the area
Home Values in the Area
Average Home Value in this Area
Purchase History
| Date | Buyer | Sale Price | Title Company |
|---|---|---|---|
| Ket New Loo | -- | None Available | |
| Moo Saw Gay | $175,000 | None Available | |
| Yang John | $50,000 | -- | |
| Thao Henry | $134,000 | -- | |
| Hous Thao | $56,200 | -- |
Source: Public Records
Mortgage History
| Date | Status | Borrower | Loan Amount |
|---|---|---|---|
| Open | Ket New Loo | $170,500 | |
| Closed | Moo Saw Gay | $171,830 |
Source: Public Records
Tax History Compared to Growth
Tax History
| Year | Tax Paid | Tax Assessment Tax Assessment Total Assessment is a certain percentage of the fair market value that is determined by local assessors to be the total taxable value of land and additions on the property. | Land | Improvement |
|---|---|---|---|---|
| 2025 | $3,822 | $254,700 | $25,000 | $229,700 |
| 2023 | $3,822 | $234,900 | $20,000 | $214,900 |
| 2022 | $2,902 | $231,400 | $20,000 | $211,400 |
| 2021 | $2,734 | $191,000 | $20,000 | $171,000 |
| 2020 | $2,770 | $177,900 | $7,000 | $170,900 |
| 2019 | $2,398 | $177,900 | $7,000 | $170,900 |
| 2018 | $1,964 | $155,000 | $7,000 | $148,000 |
| 2017 | $1,594 | $115,200 | $7,000 | $108,200 |
| 2016 | $1,664 | $0 | $0 | $0 |
| 2015 | $1,622 | $97,800 | $7,000 | $90,800 |
| 2014 | $1,636 | $0 | $0 | $0 |
Source: Public Records
Map
Nearby Homes