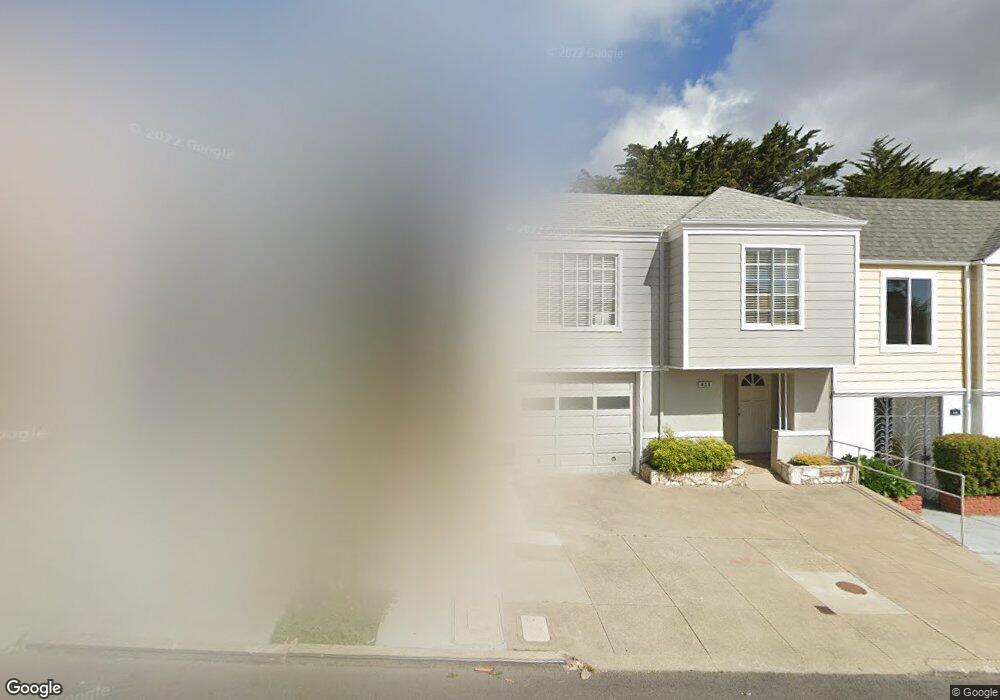
844 Duncan St San Francisco, CA 94131
Noe Valley NeighborhoodEstimated Value: $4,159,000 - $4,775,000
4
Beds
5
Baths
2,985
Sq Ft
$1,525/Sq Ft
Est. Value
About This Home
This home is located at 844 Duncan St, San Francisco, CA 94131 and is currently estimated at $4,550,644, approximately $1,524 per square foot. 844 Duncan St is a home located in San Francisco County with nearby schools including Alvarado Elementary, James Lick Middle School, and St. Philip School.
Ownership History
Date
Name
Owned For
Owner Type
Purchase Details
Closed on
Mar 10, 2021
Sold by
Ryu Marcus
Bought by
Ryu Marcus and Ryu Julia Sophia
Current Estimated Value
Purchase Details
Closed on
Feb 7, 2019
Sold by
Paluru Prasuna and Prabhu Chethan
Bought by
Ryu Marcus
Purchase Details
Closed on
Aug 15, 2014
Sold by
Jerez Jose Ernesto
Bought by
Paluru Prasuna and Prabhu Chethan
Home Financials for this Owner
Home Financials are based on the most recent Mortgage that was taken out on this home.
Original Mortgage
$1,079,200
Interest Rate
4.11%
Mortgage Type
New Conventional
Purchase Details
Closed on
Sep 15, 1999
Sold by
Karl Chang and Lei Xu Jia
Bought by
Parisi Lionel L and Parisi Vivienne J
Purchase Details
Closed on
Jul 30, 1996
Sold by
Tucker Howard L and Tucker Tere M
Bought by
Tucker Howard L and Tucker Tere M
Create a Home Valuation Report for This Property
The Home Valuation Report is an in-depth analysis detailing your home's value as well as a comparison with similar homes in the area
Home Values in the Area
Average Home Value in this Area
Purchase History
| Date | Buyer | Sale Price | Title Company |
|---|---|---|---|
| Ryu Marcus | -- | None Available | |
| Ryu Marcus | $4,500,000 | Chicago Title Co | |
| Ryu Marcus | -- | Chicago Title Co | |
| Paluru Prasuna | $1,349,000 | Chicago Title Company | |
| Parisi Lionel L | $899,000 | Old Republic Title Company | |
| Tucker Howard L | -- | -- |
Source: Public Records
Mortgage History
| Date | Status | Borrower | Loan Amount |
|---|---|---|---|
| Previous Owner | Paluru Prasuna | $1,079,200 |
Source: Public Records
Tax History Compared to Growth
Tax History
| Year | Tax Paid | Tax Assessment Tax Assessment Total Assessment is a certain percentage of the fair market value that is determined by local assessors to be the total taxable value of land and additions on the property. | Land | Improvement |
|---|---|---|---|---|
| 2025 | $58,358 | $5,019,830 | $3,513,882 | $1,505,948 |
| 2024 | $58,358 | $4,921,403 | $3,444,983 | $1,476,420 |
| 2023 | $57,506 | $4,824,906 | $3,377,435 | $1,447,471 |
| 2022 | $56,455 | $4,730,301 | $3,311,211 | $1,419,090 |
| 2021 | $55,552 | $4,637,551 | $3,246,286 | $1,391,265 |
| 2020 | $55,800 | $4,590,000 | $3,213,000 | $1,377,000 |
| 2019 | $24,953 | $2,053,397 | $1,017,379 | $1,036,018 |
| 2018 | $19,596 | $1,624,900 | $997,431 | $627,469 |
| 2017 | $16,768 | $1,396,962 | $977,874 | $419,088 |
| 2016 | $16,502 | $1,369,571 | $958,700 | $410,871 |
| 2015 | $16,299 | $1,349,000 | $944,300 | $404,700 |
| 2014 | $1,123 | $66,862 | $24,100 | $42,762 |
Source: Public Records
Map
Nearby Homes
- 5177 Diamond Heights Blvd Unit 113
- 5160 Diamond Heights Blvd Unit 107C
- 55 Red Rock Way Unit 207
- 5140 Diamond Heights Blvd Unit 203A
- 175 Red Rock Way Unit 101K
- 175 Red Rock Way Unit 303K
- 4335 Cesar Chavez St
- 724 27th St
- 126 Gold Mine Dr
- 5004 Diamond Heights Blvd Unit 2
- 29 Cameo Way Unit 1
- 237 Gold Mine Dr
- 538 28th St
- 49 High St
- 524 28th St
- 298 Portola Dr Unit 103
- 45 Ora Way Unit 204A
- 4258 26th St
- 464 Hoffman Ave
- 447 Hoffman Ave