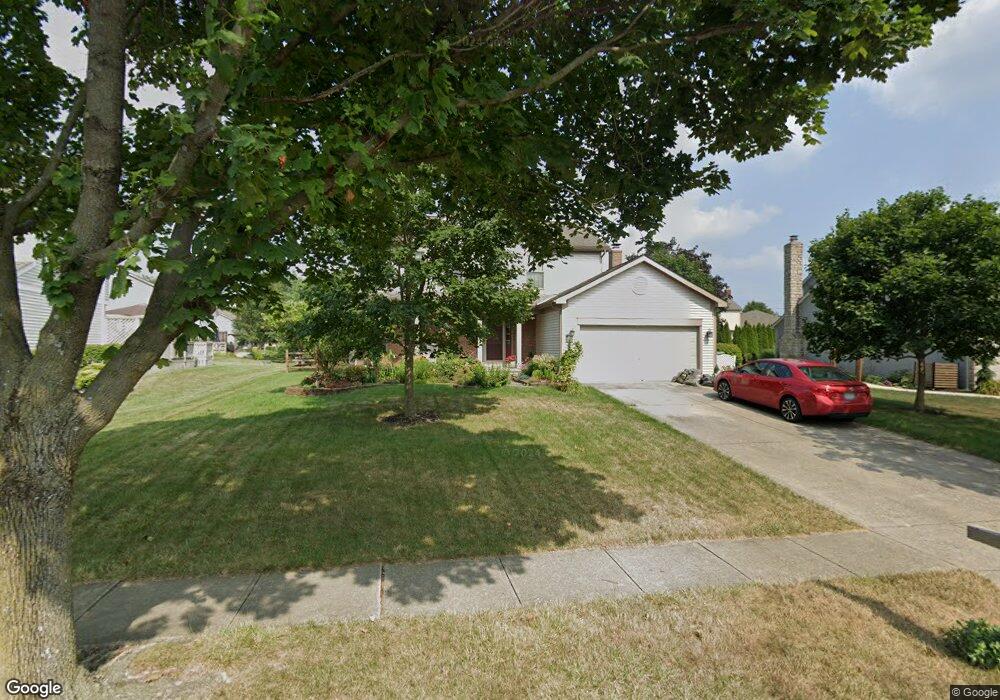
844 McLeod Parc Pickerington, OH 43147
Estimated Value: $413,000 - $441,000
About This Home
This home is located at 844 McLeod Parc, Pickerington, OH 43147 and is currently estimated at $426,864, approximately $197 per square foot. 844 McLeod Parc is a home located in Fairfield County with nearby schools including Violet Elementary School, Pickerington Lakeview Junior High School, and Toll Gate Middle School.
Ownership History
We collect this data history from publicly available records. To have your information removed, we recommend requesting removal directly through your county’s website.
Purchase Details
Home Financials for this Owner
Home Financials are based on the most recent Mortgage that was taken out on this home.Purchase Details
Home Financials for this Owner
Home Financials are based on the most recent Mortgage that was taken out on this home.Purchase Details
Home Values in the Area
Average Home Value in this Area
Purchase History
We collect this data history from publicly available records. To have your information removed, we recommend requesting removal directly through your county’s website.
| Date | Buyer | Sale Price | Title Company |
|---|---|---|---|
| $198,900 | -- | ||
| $154,050 | -- | ||
| $48,500 | -- |
Mortgage History
We collect this data history from publicly available records. To have your information removed, we recommend requesting removal directly through your county’s website.
| Date | Status | Borrower | Loan Amount |
|---|---|---|---|
| Open | $142,900 | ||
| Previous Owner | $146,300 |
Tax History
We collect this data history from publicly available records. To have your information removed, we recommend requesting removal directly through your county’s website.
| Year | Tax Paid | Tax Assessment Tax Assessment Total Assessment is a certain percentage of the fair market value that is determined by local assessors to be the total taxable value of land and additions on the property. | Land | Improvement |
|---|---|---|---|---|
| 2025 | $13,195 | $131,500 | $28,010 | $103,490 |
| 2024 | $13,195 | $107,190 | $16,220 | $90,970 |
| 2023 | $5,053 | $107,190 | $16,220 | $90,970 |
| 2022 | $5,070 | $107,190 | $16,220 | $90,970 |
| 2021 | $4,635 | $83,460 | $14,740 | $68,720 |
| 2020 | $4,657 | $83,460 | $14,740 | $68,720 |
| 2019 | $4,716 | $83,460 | $14,740 | $68,720 |
| 2018 | $4,327 | $68,370 | $14,740 | $53,630 |
| 2017 | $4,333 | $66,760 | $14,860 | $51,900 |
| 2016 | $4,312 | $66,760 | $14,860 | $51,900 |
| 2015 | $4,100 | $60,030 | $12,380 | $47,650 |
| 2014 | $4,051 | $60,030 | $12,380 | $47,650 |
| 2013 | $4,051 | $60,030 | $12,380 | $47,650 |
Map
- 859 Dunvegan Ct
- 807 Littleton Dr
- 587 Courtright Dr
- 798 Avebury Dr
- 573 Courtland Ln
- 831 Pathlow Dr
- 775 Wharncliff Loop
- 765 Avebury Dr
- 780 Diley Rd
- 672 Morello Ct
- 10038 Melody Ln
- 623 Ludham Trail
- 760 N Starr Dr
- 783 N Starr Dr
- 11655 E Meadow Ct
- 627 Ludham Trail
- 788 N Starr Dr
- 8613 Meadowton Ct
- 819 Kelburn Ln
- 340 Maple Ave
- 838 McLeod Parc
- 850 McLeod Parc
- 783 Melrose Blvd
- 839 Dunvegan Ct
- 841 Dunvegan Ct
- 779 Melrose Blvd
- 851 McLeod Parc
- 839 McLeod Parc
- 845 Dunvegan Ct
- 790 Melrose Blvd
- 835 Dunvegan Ct
- 829 McLeod Parc
- 786 Melrose Blvd
- 773 Melrose Blvd
- 826 McLeod Parc
- 782 Melrose Blvd
- 849 Dunvegan Ct
- 871 McLeod Parc
- 831 Dunvegan Ct
- 823 McLeod Parc
Ask me questions while you tour the home.