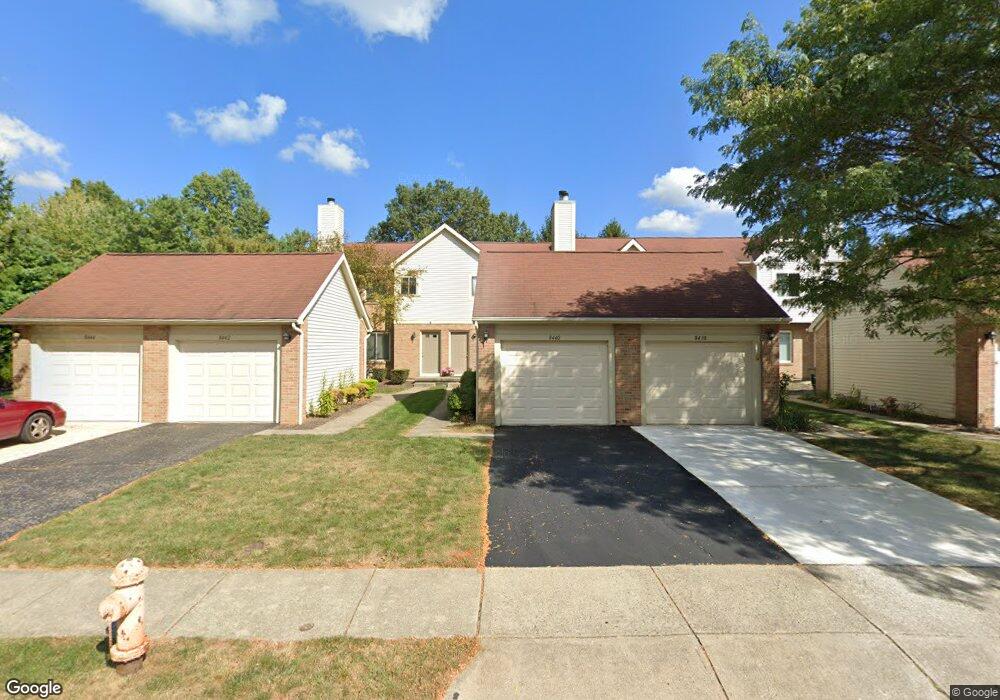
8440 Cliffthorne Way Columbus, OH 43235
Olentangy High Bluffs NeighborhoodEstimated Value: $277,000 - $298,796
2
Beds
4
Baths
1,581
Sq Ft
$182/Sq Ft
Est. Value
About This Home
This home is located at 8440 Cliffthorne Way, Columbus, OH 43235 and is currently estimated at $288,449, approximately $182 per square foot. 8440 Cliffthorne Way is a home located in Franklin County with nearby schools including Worthington Hills Elementary School, McCord Middle School, and Worthington Kilbourne High School.
Ownership History
Date
Name
Owned For
Owner Type
Purchase Details
Closed on
Jul 15, 2021
Sold by
Everard Misty D and Everard Nathan A
Bought by
Everard Misty D
Current Estimated Value
Home Financials for this Owner
Home Financials are based on the most recent Mortgage that was taken out on this home.
Original Mortgage
$111,000
Outstanding Balance
$100,404
Interest Rate
2.7%
Mortgage Type
New Conventional
Estimated Equity
$188,045
Purchase Details
Closed on
May 18, 2007
Sold by
Johnson Byron H
Bought by
Everard Nathan A and Henderson Misty D
Home Financials for this Owner
Home Financials are based on the most recent Mortgage that was taken out on this home.
Original Mortgage
$136,500
Interest Rate
6.21%
Mortgage Type
Purchase Money Mortgage
Purchase Details
Closed on
May 20, 1993
Bought by
Johnson Byron H
Purchase Details
Closed on
Nov 1, 1986
Create a Home Valuation Report for This Property
The Home Valuation Report is an in-depth analysis detailing your home's value as well as a comparison with similar homes in the area
Home Values in the Area
Average Home Value in this Area
Purchase History
| Date | Buyer | Sale Price | Title Company |
|---|---|---|---|
| Everard Misty D | -- | Amrock Inc | |
| Everard Nathan A | $136,500 | Crown Searc | |
| Johnson Byron H | $74,000 | -- | |
| -- | -- | -- |
Source: Public Records
Mortgage History
| Date | Status | Borrower | Loan Amount |
|---|---|---|---|
| Open | Everard Misty D | $111,000 | |
| Closed | Everard Nathan A | $136,500 |
Source: Public Records
Tax History Compared to Growth
Tax History
| Year | Tax Paid | Tax Assessment Tax Assessment Total Assessment is a certain percentage of the fair market value that is determined by local assessors to be the total taxable value of land and additions on the property. | Land | Improvement |
|---|---|---|---|---|
| 2024 | $4,290 | $69,870 | $20,130 | $49,740 |
| 2023 | $4,102 | $69,860 | $20,125 | $49,735 |
| 2022 | $4,392 | $59,360 | $11,550 | $47,810 |
| 2021 | $4,144 | $59,360 | $11,550 | $47,810 |
| 2020 | $4,401 | $59,360 | $11,550 | $47,810 |
| 2019 | $3,595 | $48,170 | $9,630 | $38,540 |
| 2018 | $3,406 | $48,170 | $9,630 | $38,540 |
| 2017 | $3,232 | $48,170 | $9,630 | $38,540 |
| 2016 | $3,326 | $45,580 | $9,490 | $36,090 |
| 2015 | $3,326 | $45,580 | $9,490 | $36,090 |
| 2014 | $3,325 | $45,580 | $9,490 | $36,090 |
| 2013 | $1,656 | $45,570 | $9,485 | $36,085 |
Source: Public Records
Map
Nearby Homes
- 8326 Bruntsfield Rd
- 90 Northwoods Blvd Unit B
- 128 Green Springs Dr
- 67 Highland Pointe Cir Unit 67
- 8749 Olenmead Dr
- 294 Lazelle Place Ln Unit Q294
- 8747 Olenbrook Dr
- 45 Gold Meadow Dr
- 164 Cameron Ridge Dr Unit 164
- 8824 Rock Dove Rd
- 365 Cover Place
- 8750 Woodwind Dr
- 0 Pocono Rd Unit 225030021
- Fiona B Plan at Loch Lomond - Loch Lomond Hills
- 1474 Dogwood Loop
- Fiona A Plan at Loch Lomond - Loch Lomond Hills
- Fiona D Plan at Loch Lomond - Loch Lomond Hills
- Fiona C Plan at Loch Lomond - Loch Lomond Hills
- 1483 Dogwood Loop
- 7981 Oakwind Ct
- 8442 Cliffthorne Way
- 8444 Cliffthorne Way
- 8438 Cliffthorne Way
- 8436 Cliffthorne Way
- 8434 Cliffthorne Way
- 8424 Cliffthorne Way
- 8474 Nuthatch Way
- 8422 Cliffthorne Way
- 8439 Cliffthorne Way
- 8437 Cliffthorne Way
- 8420 Cliffthorne Way
- 8435 Cliffthorne Way
- 8462 Nuthatch Way
- 8433 Cliffthorne Way
- 8418 Cliffthorne Way
- 8480 Nuthatch Way
- 8415 Cliffthorne Way
- 8406 Cliffthorne Way
- 8456 Nuthatch Way
- 8413 Cliffthorne Way