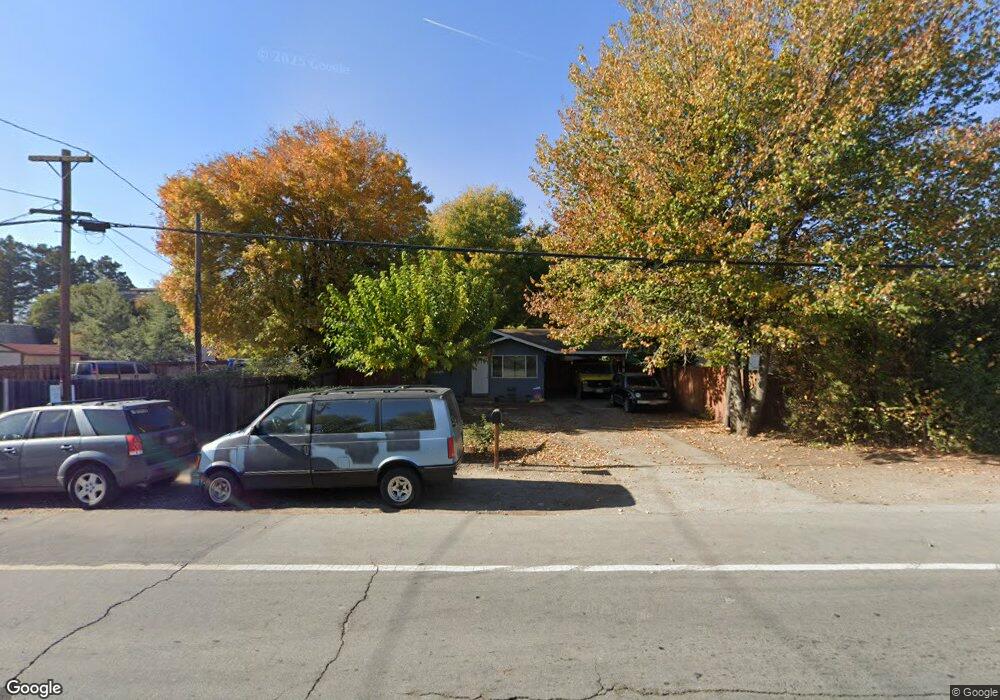
8445 Murray Ave Gilroy, CA 95020
Estimated Value: $694,000 - $876,000
1
Bed
1
Bath
782
Sq Ft
$970/Sq Ft
Est. Value
About This Home
This home is located at 8445 Murray Ave, Gilroy, CA 95020 and is currently estimated at $758,870, approximately $970 per square foot. 8445 Murray Ave is a home located in Santa Clara County with nearby schools including Rucker Elementary School, South Valley Middle School, and Solorsano Middle School.
Ownership History
Date
Name
Owned For
Owner Type
Purchase Details
Closed on
Jun 13, 2013
Sold by
Bertolone Elizabeth C
Bought by
Bertolone Elizabeth C
Current Estimated Value
Purchase Details
Closed on
Jan 10, 2003
Sold by
Leavesley Ocean Inn Vestors
Bought by
Bertolone Elizabeth C
Purchase Details
Closed on
Dec 26, 2002
Sold by
Filice Joseph A and Filice Jeanne K
Bought by
Leavesley Ocean Inn Vestors
Purchase Details
Closed on
Jul 9, 1996
Sold by
Flautt J Frank and Flautt Christine M
Bought by
Filice Joseph A and Greco Allen R
Home Financials for this Owner
Home Financials are based on the most recent Mortgage that was taken out on this home.
Original Mortgage
$224,959
Interest Rate
8.03%
Mortgage Type
Seller Take Back
Create a Home Valuation Report for This Property
The Home Valuation Report is an in-depth analysis detailing your home's value as well as a comparison with similar homes in the area
Home Values in the Area
Average Home Value in this Area
Purchase History
We collect this data history from publicly available records. To have your information removed, we recommend requesting removal directly through your county’s website.
| Date | Buyer | Sale Price | Title Company |
|---|---|---|---|
| Bertolone Elizabeth C | -- | None Available | |
| Bertolone Elizabeth C | $600,000 | Chicago Title | |
| Leavesley Ocean Inn Vestors | $600,000 | Chicago Title | |
| Filice Joseph A | $300,000 | Old Republic Title Company |
Source: Public Records
Mortgage History
We collect this data history from publicly available records. To have your information removed, we recommend requesting removal directly through your county’s website.
| Date | Status | Borrower | Loan Amount |
|---|---|---|---|
| Previous Owner | Filice Joseph A | $224,959 |
Source: Public Records
Tax History
| Year | Tax Paid | Tax Assessment Tax Assessment Total Assessment is a certain percentage of the fair market value that is determined by local assessors to be the total taxable value of land and additions on the property. | Land | Improvement |
|---|---|---|---|---|
| 2025 | $5,265 | $434,479 | $304,141 | $130,338 |
| 2024 | $5,265 | $425,961 | $298,178 | $127,783 |
| 2023 | $5,232 | $417,610 | $292,332 | $125,278 |
| 2022 | $5,144 | $409,422 | $286,600 | $122,822 |
| 2021 | $5,119 | $401,395 | $280,981 | $120,414 |
| 2020 | $5,062 | $397,280 | $278,100 | $119,180 |
| 2019 | $5,014 | $389,492 | $272,648 | $116,844 |
| 2018 | $4,682 | $381,855 | $267,302 | $114,553 |
| 2017 | $4,778 | $374,368 | $262,061 | $112,307 |
| 2016 | $4,676 | $367,028 | $256,923 | $110,105 |
| 2015 | $4,354 | $356,700 | $249,600 | $107,100 |
| 2014 | $4,283 | $346,300 | $242,400 | $103,900 |
Source: Public Records
Map
Nearby Homes
- 0000 Hecker Pass
- 8240 Springdale Ct
- 3115 B Leavesley Rd
- 8282 Murray Ave Unit 99
- 401 Arnold Dr
- 408 La Sierra Way
- 7759 Murray Ave
- 7711 Monterey St
- 160 Sarafina Way
- 700 Las Animas Ave
- 620 Broadway
- 626 Broadway
- 622 Broadway
- 500 Ronan Ave
- 332 Lewis St Unit 1/2
- 332 Lewis St
- 125 Bennett St
- 741 Baxter Way
- 590 El Invierno Dr
- 7601 Rosanna St
Your Personal Tour Guide
Ask me questions while you tour the home.