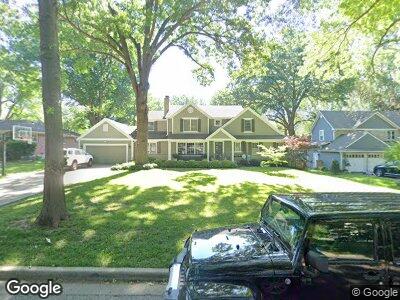
8449 Meadow Ln Leawood, KS 66206
Estimated Value: $900,790 - $1,209,000
7
Beds
5
Baths
3,189
Sq Ft
$314/Sq Ft
Est. Value
About This Home
This home is located at 8449 Meadow Ln, Leawood, KS 66206 and is currently estimated at $1,000,448, approximately $313 per square foot. 8449 Meadow Ln is a home located in Johnson County with nearby schools including Corinth Elementary School, Indian Hills Middle School, and Shawnee Mission East High School.
Ownership History
Date
Name
Owned For
Owner Type
Purchase Details
Closed on
Jun 28, 2005
Sold by
Haake Development Inc
Bought by
Poskin Richard J and Poskin Mary F
Current Estimated Value
Home Financials for this Owner
Home Financials are based on the most recent Mortgage that was taken out on this home.
Original Mortgage
$210,000
Interest Rate
5.63%
Mortgage Type
New Conventional
Purchase Details
Closed on
Mar 8, 2005
Sold by
Pettit Robert Dean and Pettit Robert D
Bought by
Haake Development Inc
Home Financials for this Owner
Home Financials are based on the most recent Mortgage that was taken out on this home.
Original Mortgage
$420,000
Interest Rate
5.66%
Mortgage Type
Future Advance Clause Open End Mortgage
Create a Home Valuation Report for This Property
The Home Valuation Report is an in-depth analysis detailing your home's value as well as a comparison with similar homes in the area
Home Values in the Area
Average Home Value in this Area
Purchase History
| Date | Buyer | Sale Price | Title Company |
|---|---|---|---|
| Poskin Richard J | -- | First American Title | |
| Haake Development Inc | -- | Continental Title Co |
Source: Public Records
Mortgage History
| Date | Status | Borrower | Loan Amount |
|---|---|---|---|
| Open | Pollock Thomas W | $500,000 | |
| Closed | Pollock Thomas W | $250,000 | |
| Closed | Pollock Thomas W | $100,000 | |
| Closed | Pollock Thomas W | $55,000 | |
| Closed | Pollock Thomas W | $414,000 | |
| Closed | Pollock Thomas W | $464,925 | |
| Closed | Poskin Richard J | $210,000 | |
| Previous Owner | Haake Development Inc | $420,000 |
Source: Public Records
Tax History Compared to Growth
Tax History
| Year | Tax Paid | Tax Assessment Tax Assessment Total Assessment is a certain percentage of the fair market value that is determined by local assessors to be the total taxable value of land and additions on the property. | Land | Improvement |
|---|---|---|---|---|
| 2024 | $10,638 | $99,544 | $34,387 | $65,157 |
| 2023 | $10,318 | $96,151 | $31,266 | $64,885 |
| 2022 | $9,428 | $87,998 | $28,421 | $59,577 |
| 2021 | $9,211 | $82,708 | $28,421 | $54,287 |
| 2020 | $8,259 | $73,106 | $25,829 | $47,277 |
| 2019 | $8,339 | $73,991 | $21,526 | $52,465 |
| 2018 | $8,153 | $72,094 | $21,526 | $50,568 |
| 2017 | $8,262 | $71,910 | $16,551 | $55,359 |
| 2016 | $8,499 | $73,014 | $12,733 | $60,281 |
| 2015 | $8,292 | $71,795 | $12,733 | $59,062 |
| 2013 | -- | $69,759 | $10,603 | $59,156 |
Source: Public Records
Map
Nearby Homes
- 8429 Meadow Ln
- 8514 Belinder Rd
- 2816 W 87th Terrace
- 2400 W 86th Terrace
- 8706 Lee Blvd
- 8324 Meadow Ln
- 8715 High Dr
- 8721 Ensley Ln
- 8416 Cambridge St
- 8301 Lee Blvd
- 3116 W 86th St
- 8120 Lee Blvd
- 2144 W 89th Terrace
- 2189 W 89th Place
- 8414 Reinhardt Ln
- 2815 W 82nd St
- 8025 Meadow Ln
- 8020 Meadow Ln
- 8025 Manor Rd
- 8308 Mercier St