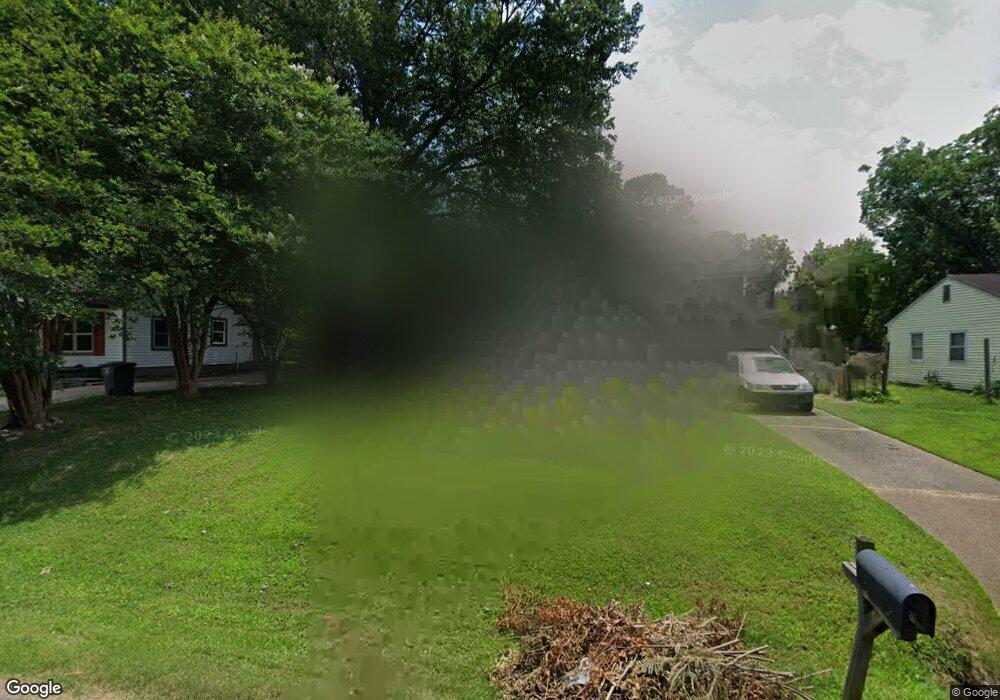
845 Floyd Ave Memphis, TN 38127
Frayser NeighborhoodEstimated Value: $83,000 - $112,000
3
Beds
1
Bath
875
Sq Ft
$119/Sq Ft
Est. Value
About This Home
This home is located at 845 Floyd Ave, Memphis, TN 38127 and is currently estimated at $104,281, approximately $119 per square foot. 845 Floyd Ave is a home located in Shelby County with nearby schools including Westside Elementary School, Grandview Heights Middle, and Trezevant High School.
Ownership History
Date
Name
Owned For
Owner Type
Purchase Details
Closed on
Jun 6, 2025
Sold by
Mid South Homebuyers Llc
Bought by
Stoltzfus Jacob
Current Estimated Value
Home Financials for this Owner
Home Financials are based on the most recent Mortgage that was taken out on this home.
Original Mortgage
$86,400
Outstanding Balance
$86,025
Interest Rate
6.76%
Mortgage Type
New Conventional
Estimated Equity
$18,256
Purchase Details
Closed on
Feb 24, 2025
Sold by
Osgood Anita
Bought by
Mid South Homebuyers Llc
Purchase Details
Closed on
Jul 8, 1998
Sold by
Mccastlain John C
Bought by
Mccastlain Anita O
Create a Home Valuation Report for This Property
The Home Valuation Report is an in-depth analysis detailing your home's value as well as a comparison with similar homes in the area
Home Values in the Area
Average Home Value in this Area
Purchase History
| Date | Buyer | Sale Price | Title Company |
|---|---|---|---|
| Stoltzfus Jacob | $112,400 | None Listed On Document | |
| Mid South Homebuyers Llc | $18,000 | None Listed On Document | |
| Mccastlain Anita O | -- | -- | |
| Mccastlain Anita O | -- | -- |
Source: Public Records
Mortgage History
| Date | Status | Borrower | Loan Amount |
|---|---|---|---|
| Open | Stoltzfus Jacob | $86,400 |
Source: Public Records
Tax History
| Year | Tax Paid | Tax Assessment Tax Assessment Total Assessment is a certain percentage of the fair market value that is determined by local assessors to be the total taxable value of land and additions on the property. | Land | Improvement |
|---|---|---|---|---|
| 2025 | $336 | $14,375 | $1,625 | $12,750 |
| 2024 | $336 | $9,925 | $1,275 | $8,650 |
| 2023 | $605 | $9,925 | $1,275 | $8,650 |
| 2022 | $605 | $9,925 | $1,275 | $8,650 |
| 2021 | $612 | $9,925 | $1,275 | $8,650 |
| 2020 | $480 | $6,625 | $1,275 | $5,350 |
| 2019 | $480 | $6,625 | $1,275 | $5,350 |
| 2018 | $480 | $6,625 | $1,275 | $5,350 |
| 2017 | $272 | $6,625 | $1,275 | $5,350 |
| 2016 | $346 | $7,925 | $0 | $0 |
| 2014 | $346 | $7,925 | $0 | $0 |
Source: Public Records
Map
Nearby Homes
Your Personal Tour Guide
Ask me questions while you tour the home.