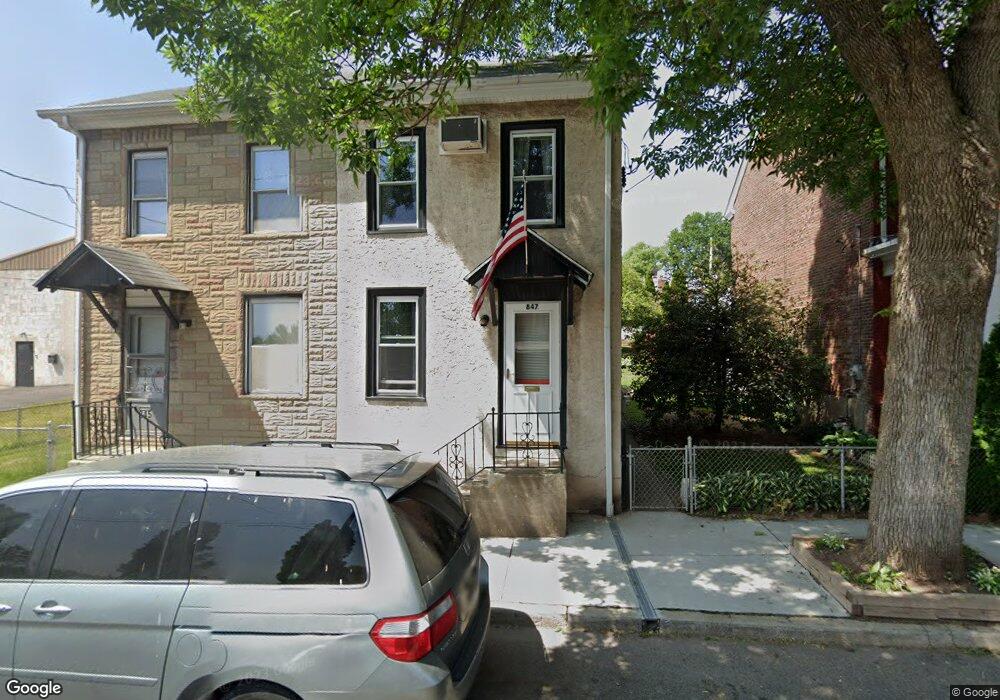
845 Queen St Pottstown, PA 19464
East End South NeighborhoodEstimated Value: $139,000 - $244,900
2
Beds
1
Bath
896
Sq Ft
$205/Sq Ft
Est. Value
About This Home
This home is located at 845 Queen St, Pottstown, PA 19464 and is currently estimated at $183,725, approximately $205 per square foot. 845 Queen St is a home located in Montgomery County with nearby schools including Pottstown Middle School, Pottstown Senior High School, and Saint Aloysius Parish School.
Ownership History
Date
Name
Owned For
Owner Type
Purchase Details
Closed on
Oct 17, 2022
Sold by
Dunlap James C and Miller Denise Lynn
Bought by
Orr James C
Current Estimated Value
Home Financials for this Owner
Home Financials are based on the most recent Mortgage that was taken out on this home.
Original Mortgage
$84,000
Outstanding Balance
$80,748
Interest Rate
5.89%
Mortgage Type
New Conventional
Estimated Equity
$102,977
Purchase Details
Closed on
Jan 1, 1962
Bought by
Dunlap James C and Dunlap Roberta J
Create a Home Valuation Report for This Property
The Home Valuation Report is an in-depth analysis detailing your home's value as well as a comparison with similar homes in the area
Home Values in the Area
Average Home Value in this Area
Purchase History
| Date | Buyer | Sale Price | Title Company |
|---|---|---|---|
| Orr James C | $105,000 | None Listed On Document | |
| Dunlap James C | -- | -- |
Source: Public Records
Mortgage History
| Date | Status | Borrower | Loan Amount |
|---|---|---|---|
| Open | Orr James C | $84,000 |
Source: Public Records
Tax History Compared to Growth
Tax History
| Year | Tax Paid | Tax Assessment Tax Assessment Total Assessment is a certain percentage of the fair market value that is determined by local assessors to be the total taxable value of land and additions on the property. | Land | Improvement |
|---|---|---|---|---|
| 2025 | $4,132 | $67,350 | $32,040 | $35,310 |
| 2024 | $4,132 | $67,350 | $32,040 | $35,310 |
| 2023 | $4,076 | $67,350 | $32,040 | $35,310 |
| 2022 | $4,056 | $67,350 | $32,040 | $35,310 |
| 2021 | $4,009 | $67,350 | $32,040 | $35,310 |
| 2020 | $3,939 | $67,350 | $32,040 | $35,310 |
| 2019 | $3,849 | $67,350 | $32,040 | $35,310 |
| 2018 | $2,345 | $67,350 | $32,040 | $35,310 |
| 2017 | $3,599 | $67,350 | $32,040 | $35,310 |
| 2016 | $3,573 | $67,350 | $32,040 | $35,310 |
| 2015 | $3,550 | $67,350 | $32,040 | $35,310 |
| 2014 | $3,550 | $67,350 | $32,040 | $35,310 |
Source: Public Records
Map
Nearby Homes